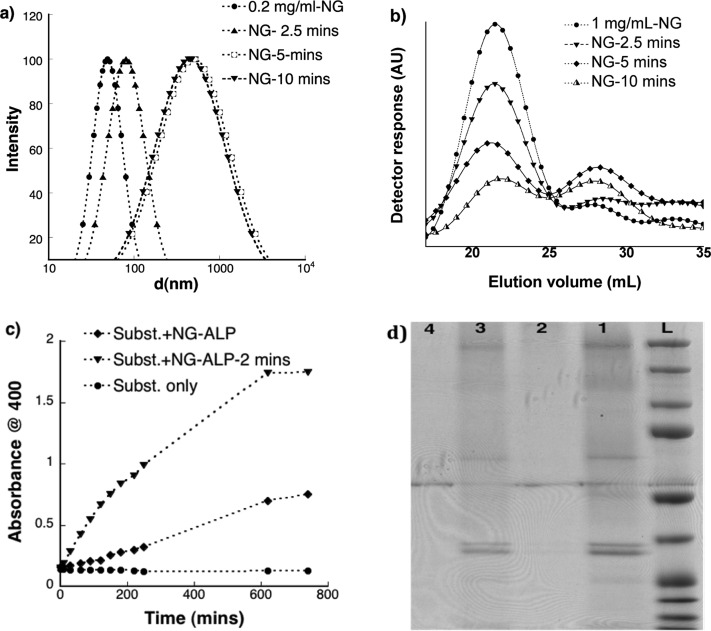
Figure 2.
Studies of photoresponsive properties and protein release: (a) Change in hydrodynamic size of nanogel (0.2 mg/mL) at different time of light exposures (2.5, 5 and 10 min) using DLS; (b) GPC traces outlining light induced degradation of nanogel (1.0 mg/mL); (c) Control over protein activity: Evolution of p-NP (λmax: 400 nm) upon exposing p-NPP substrate (0.2 mM) to ALP loaded nanogel (0.2 mg/mL) and its light exposed (2 min of exposure) counterpart in UV–vis; (d) SDS-PAGE electrophoresis depicting protein release: L - ladder; 1- native ALP; 2- ALP loaded nanogel; 3- ALP loaded nanogel after exposure to light (2 min); 4 - blank nanogel (not loaded with ALP).

