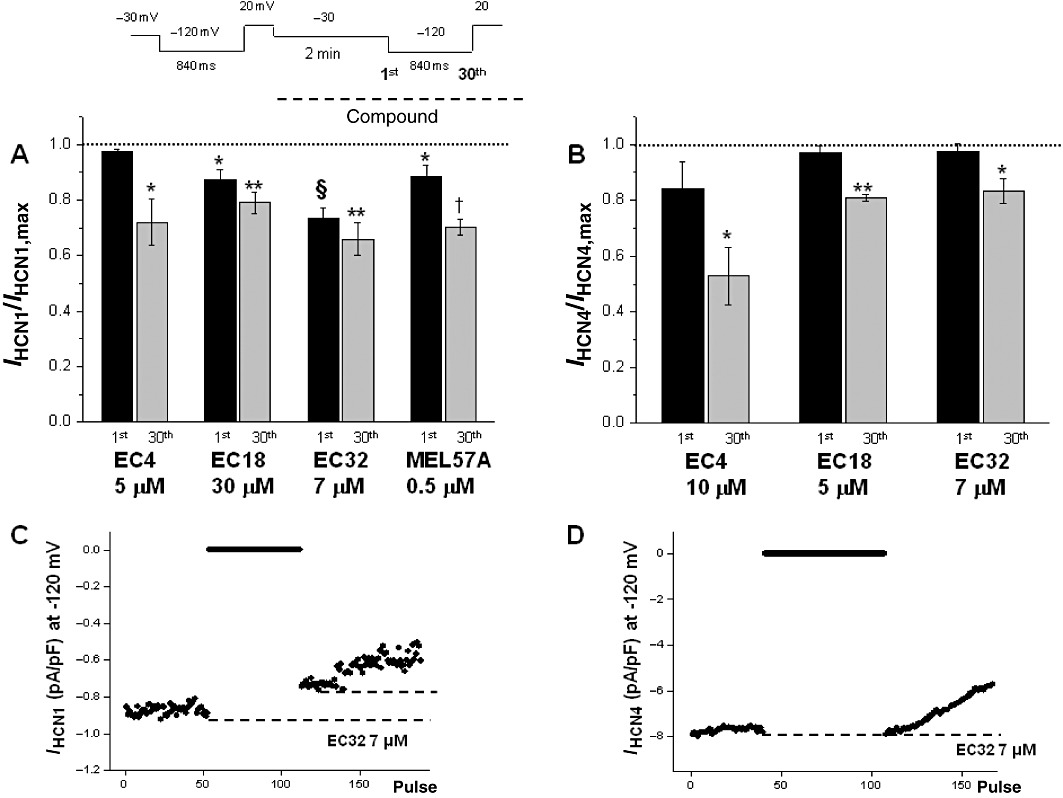
Figure 4.

Properties of HCN blockade. Histograms show current values measured in the presence of compounds (used at concentrations around EC50 obtained for each HCN isoform), measured at the first (1st) and the 30th step after restoring hyperpolarization, following a 2 min pulse at −30 mV (see text and voltage protocol at the top). Values were normalized with respect to the pre-drug value (dotted line). (A) mHCN1; (B) hHCN4. (C and D) Examples of the current at −120 mV recorded in HCN1 (C) and in HCN4 (D) during the experiment time course (indicated at the top of figure) in the presence of 7 µM EC32. The dotted lines indicate the current values during the activation of the channel in the presence of EC32 before the period at −30 mV and immediately after resuming stimulation. In the case of mHCN1 (C), the difference between the dotted lines represents the ‘closed channel’ blockade; as for hHCN4 (D), the lack of difference between the levels indicates that channel blockade occurs only after stimulation was resumed. n= 4, *P < 0.05, **P < 0.01; §P < 0.001; †P < 0.0001 versus CTR.
