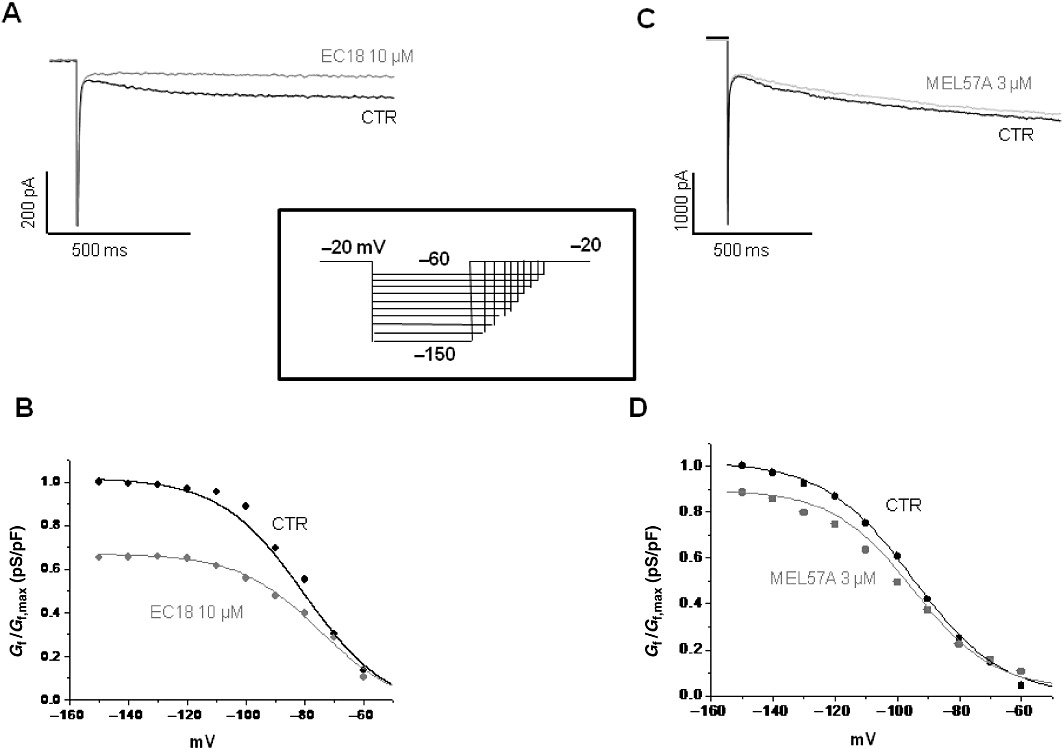
Figure 5.

Effects of EC18 and MEL57A on guinea pig SAN single cells. If traces were recorded at −120 mV in guinea pig single SAN cell, in the absence (CTR) and in the presence of 10 µM EC18 (A) or 3 µM MEL57A (C) by using the protocol shown in the inset. The corresponding activation curves for 10 µM EC18 and 3 µM MEL57A are shown in (B) and (D), respectively. Plot presents current conductance normalized with respect to maximal conductance (Gf/Gf,max) versus membrane potential (mV).
