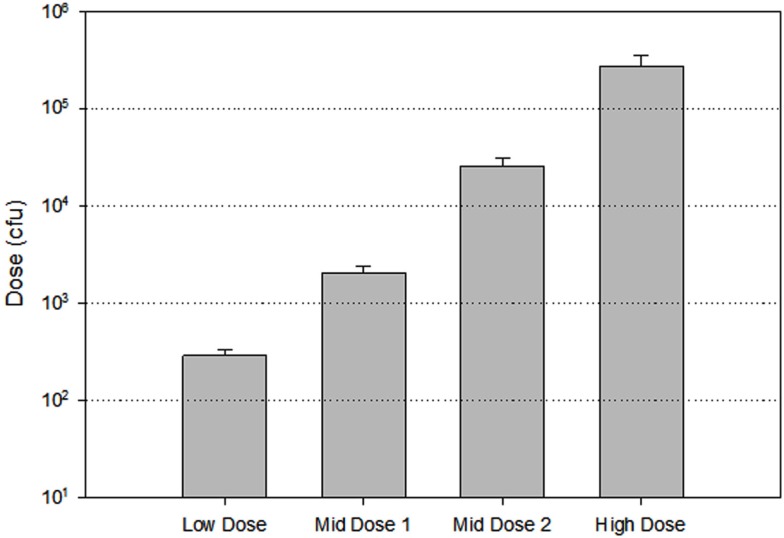
Figure 2.
Mean acute single day low-dose inhalation challenge data. The figure illustrates the mean inhaled dose (bars) with standard deviation compared to the target doses (dashed horizontal log increment lines). The low-dose target was 102, the mid-dose1 target was 103, the mid-dose 2 target was 104, and the high-dose target was 105.

