
Figure 5.
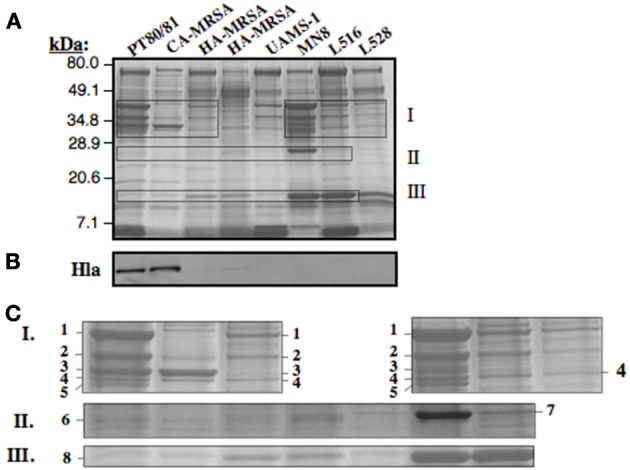
Assessment of CC30 secreted proteins by SDS-PAGE (A) and Western blot for detection of Hla (B). The individual strains are the same as defined in Figure 3G. For visualization of secreted proteins by Coomassie Blue staining (A), a total of 3.0 OD600 units of cell-free culture supernatant was applied to each lane, while 0.02 OD units was applied in Figure 3B. Zones I, II, and III as outlined in the SDS-PAGE gel (A) are enlarged in Figure 3C. The numbered protein bands were excised from the gel, followed by trypsin digestion and mass spectrometry. The identity of proteins in each band is provided in Table 3.