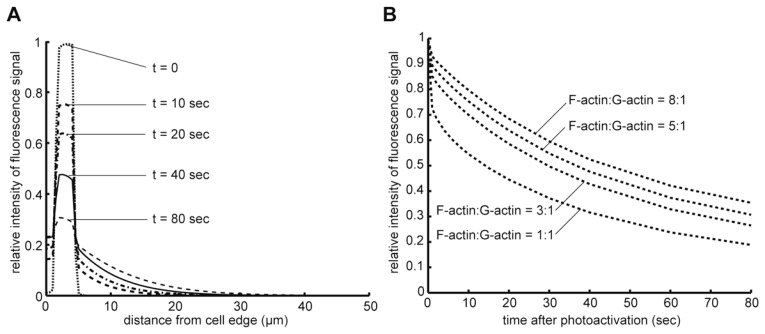
Fig. 3.
Simulation of PAF (photoactivation of fluorescence) experiments using the Tardy model: a delay in the recovery kinetics due to local reincorporation. Tardy et al.52) mathematically analyzed actin-based PAF and FRAP experiments incorporating the exchange between F-actin and G-actin. Although the model does not consider uneven distribution of F-actin and the retrograde actin flow, the early decay or recovery kinetics in the local cell environment can be estimated by this model. (A) The time-resolved distribution of PAF signals in a 50 μm wide cell. The photoactivation label is placed between 1.5 μm and 4.5 μm away from the cell edge. Diffusion constant of G-actin, the turnover rate from F-actin to G-actin and the ratio between F- and G-actin are 4.0 × 10⁻⁸ cm2/s,7) 0.03 s−1 and 5:1, respectively. Although the overall ratio between F- and G-actin is about 1:1, F-actin exists at ~1000 μM in lamellipodia,53) which should lead to a local high F-/G-actin concentration ratio. (B) Dependency of PAF signal decay on the ratio between F- and G-actin. The conditions are the same as above except for the F-/G-actin ratios. Note that the simulated decay rate of PAF labels becomes substantially slower (apparent T1/2 is approximately 30~50 sec) than the true F-actin disassembly rate (T1/2 = 23 sec).

