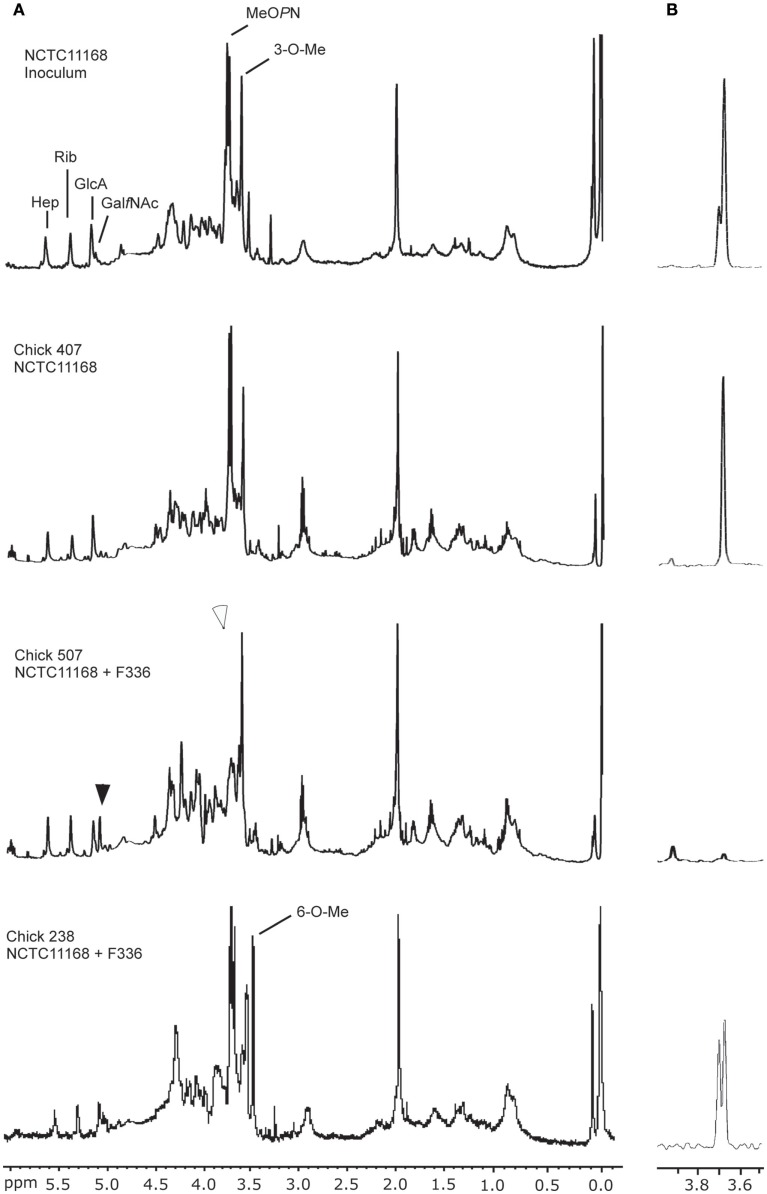
Figure 4.
NMR analysis of intact C. jejuni cells recovered from chicken cecal contents. (A) 1H HR-MAS NMR CPMG spectra, displaying the capsular profile and (B) corresponding 1D 1H–31P HSQC spectra specifically demonstrating the phosphoramidate resonances. Black arrowhead: note the change in the GalfNAc resonance due to the absence of MeOPN. White arrowhead: note the absence of the MeOPN specific resonance.

