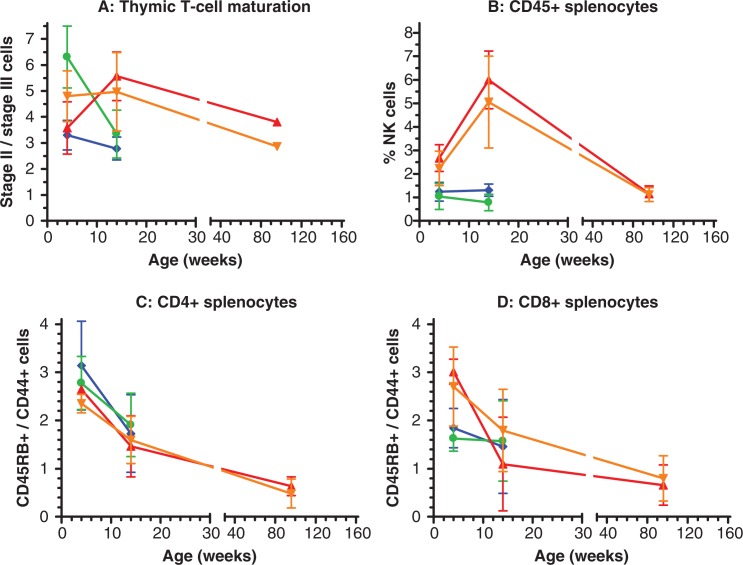
Fig. 5.
Lymphocyte subset distributions in Ercc1 −/Δ7 and Ercc1 +/+ mice at cross-sectional age groups. A: T-cell distribution in the thymus as ratios of immature, stage II cells over mature stage III cells. B: Percentage of natural killer cells among CD45 positive splenocytes. C: Ratio of naïve over memory CD4 positive T-cells in spleen. D: Ratio of naïve over memory CD8 positive T-cells in spleen. All symbols display means of n=5, except in graph A at 96 weeks, which represent a single individual value for each sex (see text for details). The error bars indicate standard deviations. Ercc1 −/Δ7 males: blue diamonds; Ercc1 −/Δ7 females: green dots; Ercc1 +/+ males: red triangles; and Ercc1 +/+ females: orange inverted triangles.

