
Figure 1.
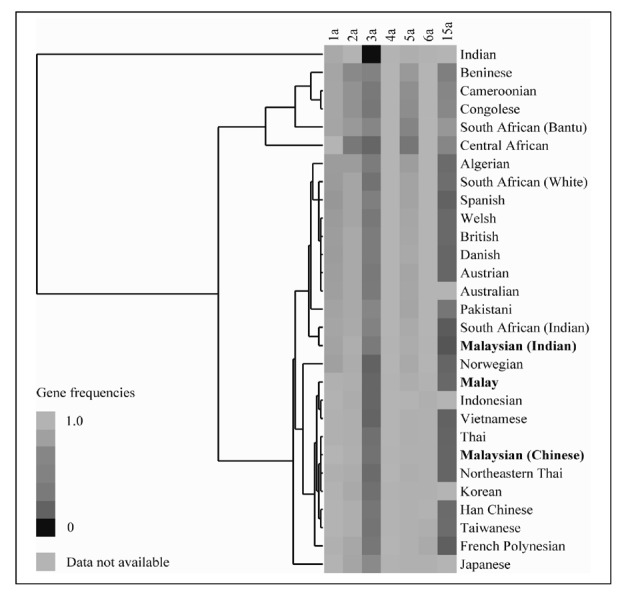
Heat-map showing gene frequencies for the “a” allele of HPA-1 to -6 and -15, together with a cluster dendrogram showing the relationships of various racial groups based on the frequency distribution.
Official websites use .gov
A
.gov website belongs to an official
government organization in the United States.
Secure .gov websites use HTTPS
A lock (
) or https:// means you've safely
connected to the .gov website. Share sensitive
information only on official, secure websites.
Heat-map showing gene frequencies for the “a” allele of HPA-1 to -6 and -15, together with a cluster dendrogram showing the relationships of various racial groups based on the frequency distribution.