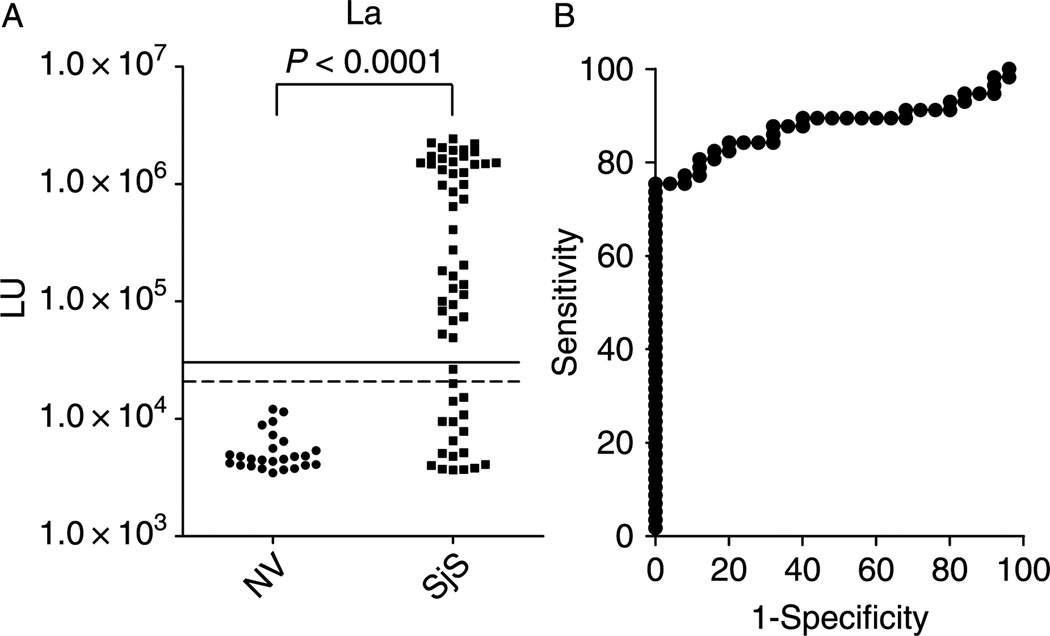
Figure 2.
LIPS detection of autoantibodies against La in 25 normal volunteers and 57 primary SjS patients. (A). Each circle or square symbol represents the anti-La antibody titer of a normal volunteer (NV) or SjS patient sample, respectively. For determining sensitivity and specificity for this anti-La antibody test, the dashed line represents the cut-off level derived from mean plus 3 SD of the antibody titer of the 25 normal volunteers, while the solid line is the cut-off for the mean plus 5 SD. p-values were calculated using the Mann Whitney U-test. (B). Roc plot analysis of anti-La antibodies detected by the LIPS test. Area under the curve (AUC) = 0.88.

