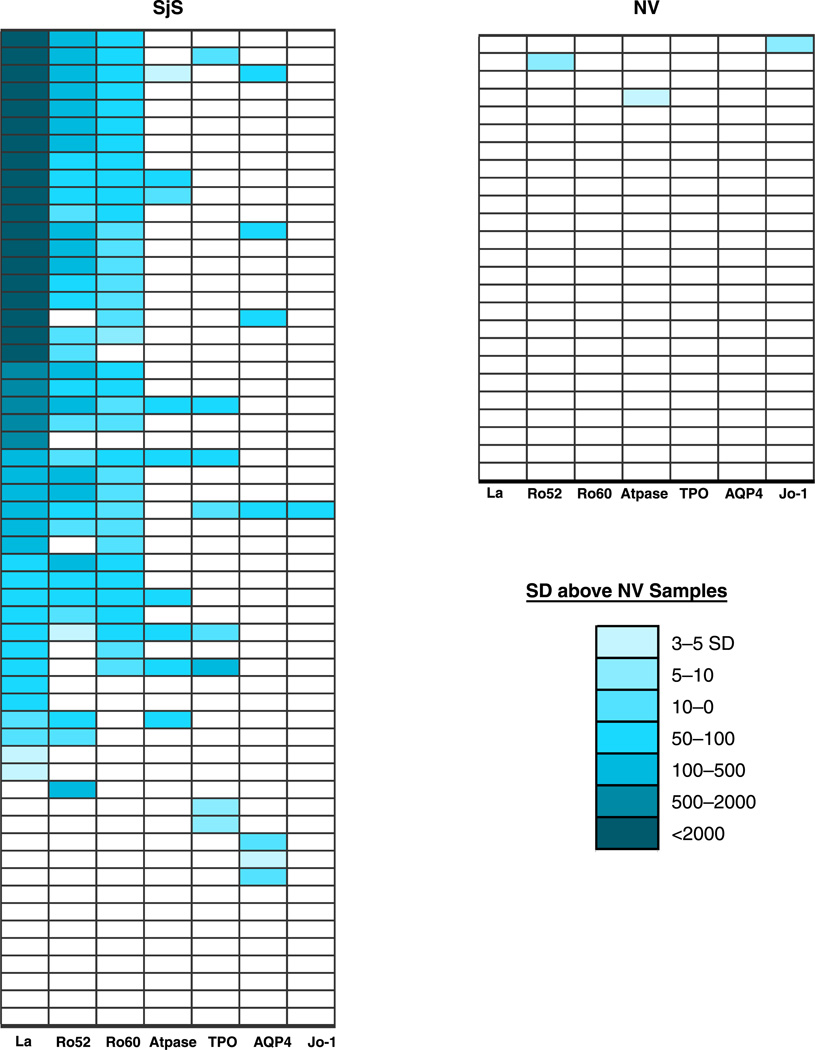
Figure 5.
Heatmap representation of SjS patient autoantibody profiles. Autoantibody titers to 7 autoantigens are shown for each of the 25 NVand 57 SjS patients. The titer values greater than the mean of the 25 normal volunteers plus 3 standard deviations were color-coded from clear to dark blue to signify the relative number of standard deviations above these reference values.

