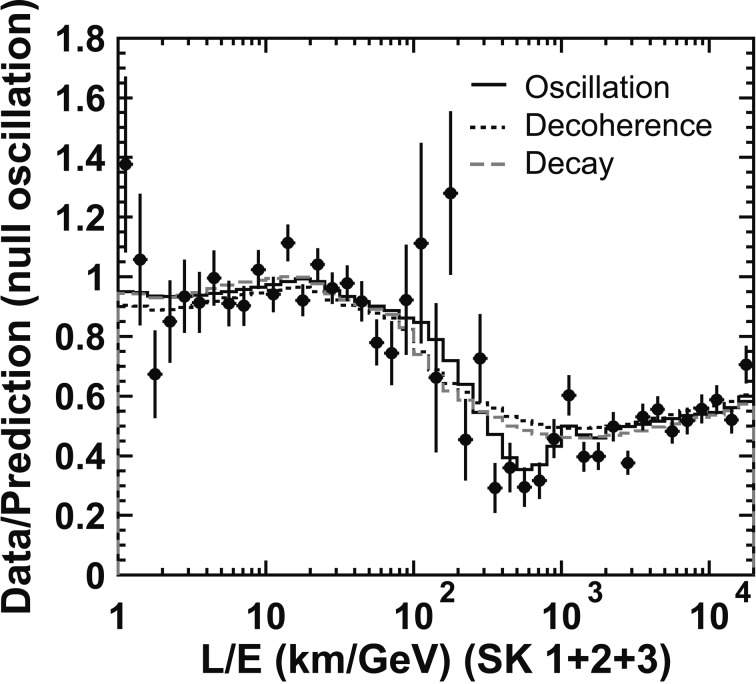
Fig. 18.
Data over non-oscillated Monte Carlo for the candidate charged-current νμ events are plotted as a function of L/Eν. The solid histogram shows the Monte Carlo prediction for νμ → ντ oscillations. The black-dotted and gray-dashed histograms show the Monte Carlo prediction for alternative models that were proposed to explain the zenith angle dependent deficit of the atmospheric neutrino data. Below about L/Eν less than 100, the data/MC value is about 1 indicating no oscillation effect. Near L/E = 500, there is a clear dip. Above L/Eν = 500, the data/MC value is about 0.5 corresponding to the averaged νμ → νμ survival probability. Data from SK-I+II+III are used.

