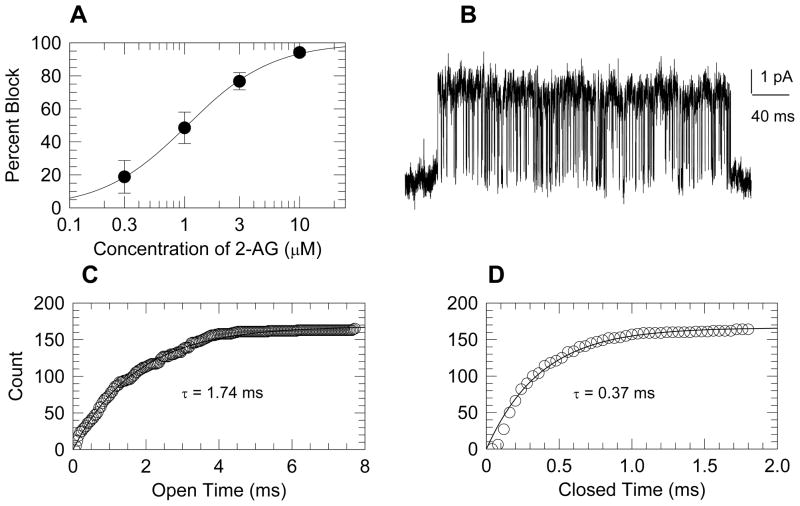
Figure 2. 2-AG blocked KATP channels.
A: Concentration response curve for the blockade of KATP channels by 2-AG. Symbols represent the mean ± sem of 7 to 11 patches. B: An example of a KATP channel burst under control conditions. C and D: Open and closed dwell times for the single burst, shown in panel B, are plotted as cumulative histograms. The experimental points are shown as symbols, and fitted exponential curves are shown as smooth curves.

