
Fig. 3.
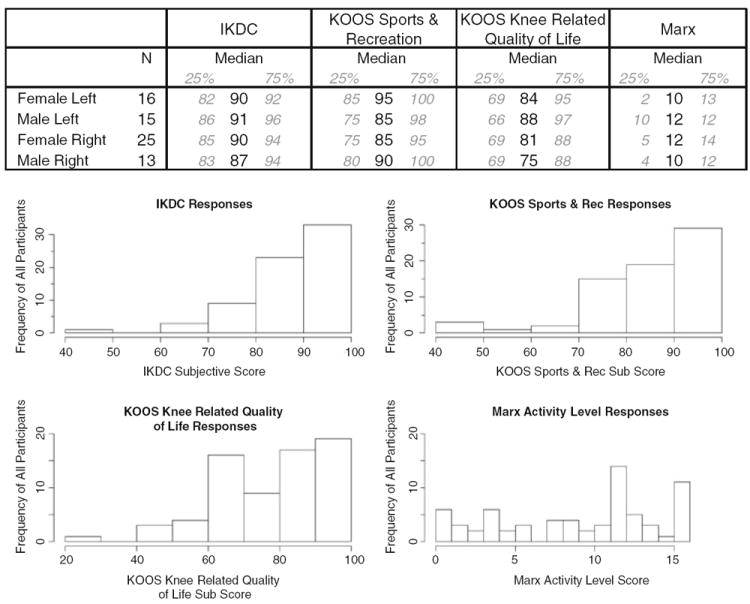
Patient-reported outcomes summary statistics. The chart shows the 25th percentile, median, and 75th percentile of hop ratios stratified by gender and side of injury, for each outcome score. The histograms show for each outcome score the frequency of ratios for the entire population. Frequencies were summed over ratios at 0.05 intervals