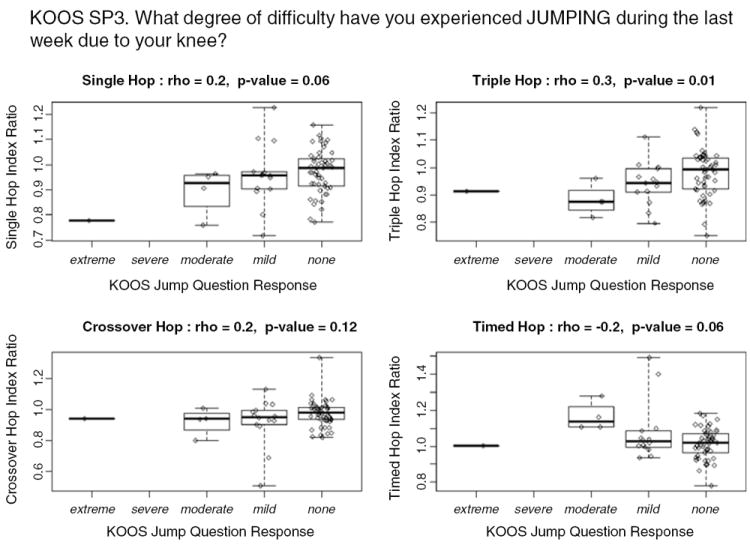
Fig. 5.

Hop ratios and KOOS jump question correlation. Box and whisker plots showing range 25th, 50th, and 75th quartiles for each hop ratio for each response. Individual ratios are represented by diamonds overlaying the box. Coefficients (rho) and P values for each Spearman correlation are above the plot. Actual jump question is provided above the graphs
