Fig. 1.
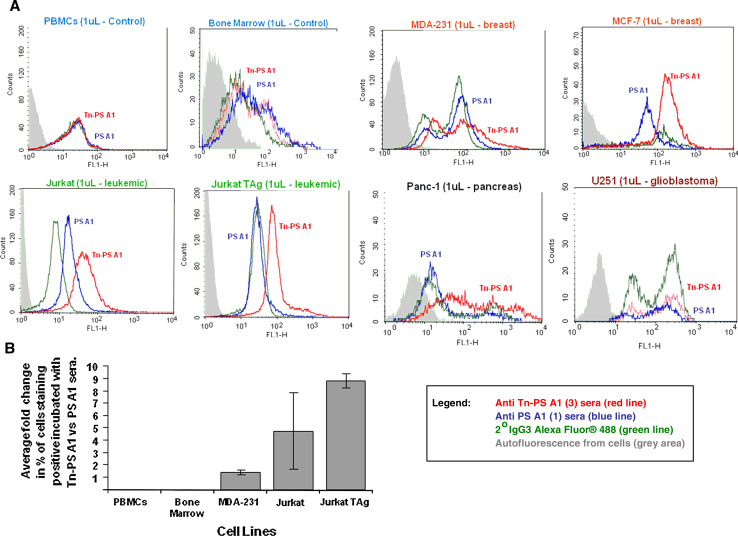
a Flow cytometry results using human tumor cell lines expressing the Tn hapten (2). Anti-sera (diluted at 1:250) from Tn-PS A1 (3)-primed C57BL/6 mice (red trace) and anti-sera (diluted at 1:250) from PS A1 (1)-primed C57BL/6 mice (blue trace) along with staining agent 2° IgG3 Ab conjugated with Alexa Fluor® 488 dye (green trace). FACS analysis shows Ab binding to MDA-231, MCF-7, Jurkat, JurkatTAg, and Panc-1 but not glioblastoma U251 (see discussion). PBMCs and bone marrow cells were used as controls. Results are representative of two replicate experiments. b Percentage of cells staining positive treated with sera from Tn-PS A1-inoculated animals compared with the percentage of cells staining with sera from PS A1 vaccinated animals. Percent of positive stained cells incubated with Tn-PS A1 sera were divided by those obtained from cells incubated with PS A1. Results represent the fold change from the average of two replicate experiments

