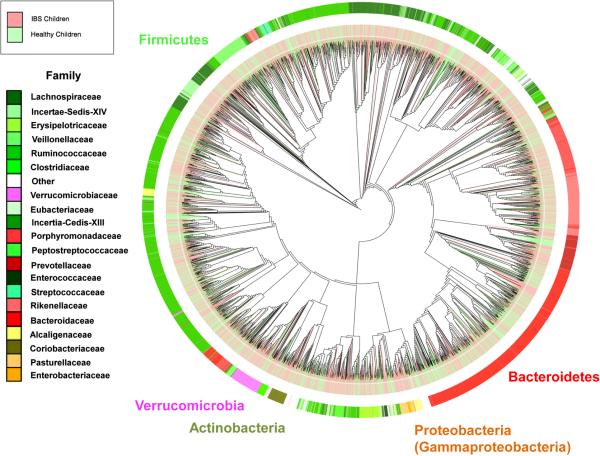
Figure 1. Global phylogenetic tree comparing the intestinal microbiomes of healthy children and children with IBS.
Phylogenetic tree was generated using QIIME and drawn with iTOL 54, including data from 22 healthy children (69 samples) and 22 children with IBS (71 samples). Map colored by phyla (exterior text), patient status (IBS - light red; Healthy - light green) and family (inset). Data were generated by 454 pyrosequencing (V1–V3 region).

