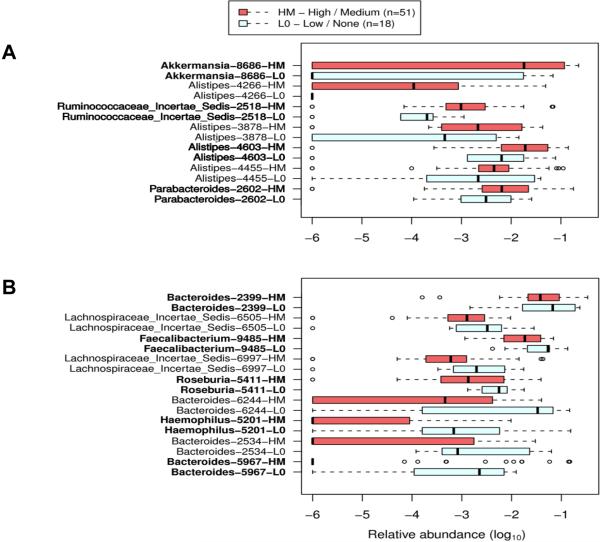
Figure 5. Differential distribution of bacterial taxa in patients with recurrent abdominal pain was correlated with the relative frequency of abdominal pain.
Bacterial taxa (specified in leftmost column) were defined by randomForest and confirmed by feature selection using Boruta. The list is sorted first by Mann-Whitney U score followed by the largest disparity in medians for each group. Taxa represent the lowest taxonomic depth (Genus) that are labeled by RDP Classifier. Red rectangles display the HM recurrent abdominal pain phenotype. Light blue rectangles display the L0 recurrent abdominal pain phenotype. Boxes represent the first quartile, median, and third quartile of the OTU distributions for each pain group. Empty circles represent outliers that are 1.5× greater than the respective interquartile ranges. A) OTUs with greater abundance in patients with HM versus L0 recurrent abdominal pain phenotypes. B) OTUs with reduced abundance in patients with HM versus L0 recurrent abdominal pain phenotypes.

