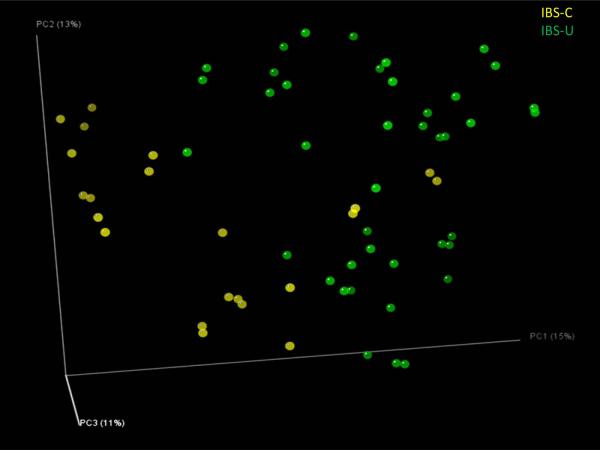
Figure 6. Distal gut microbiomes of children segregate the IBS-C and IBS-U subtypes.
 IBS-C: IBS with constipation (n=41 samples),
  IBS-U: unsubtyped IBS (n=22 samples). Bray-Curtis analysis was used to generate a matrix of pairwise sample dissimilarities between communities. The scatterplot was generated from the matrix of distances using principal components analysis. Data were generated by 454 pyrosequencing (V1–V3 region only, 2 replicates per sample).

