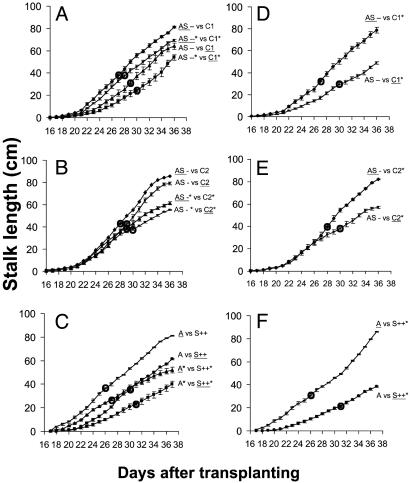
Fig. 2.
Growth and flowering time of N. attenuata genotypes differing in TPI production (see Fig. 1 for abbreviations) grown in competition with each other and either uninduced or elicited with 150 μg (*) of MeJA. Data shown stalk lengths (mean ± SEM) of the genotype (underlined) starting on the day with measurable stalk growth for 22 subsequent days; circles depict the mean day of first flowering. (A-C) Both competitors from the same pot had the same treatment: either MeJA (*) or control. (D-F) Competitors from the same pot were either treated with MeJA (*) or untreated. Stalk length (mean ± SEM) is shown for AS-- and C1 genotypes (A and D), AS- and C2 genotypes (B and E), and A and S++ genotypes (C and F).

