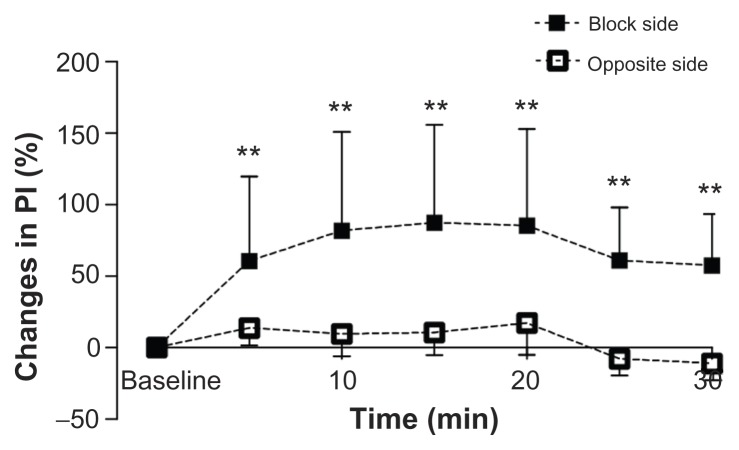
Figure 2.
Chronological changes in PI in the upper limbs. On the side of the SGB, 60.5% ± 59.3%, 81.9% ± 68.9%, 87.3% ± 68.6%, 85.4% ± 67.5%, 61.0% ± 37.0%, and 57.6% ± 35.9% increases were found at each respective time. No chronological changes were found on the opposite side of the SGB.
Note: **P < 0.01 vs baseline.
Abbreviations: SGB, stellate ganglion block; PI, perfusion index.

