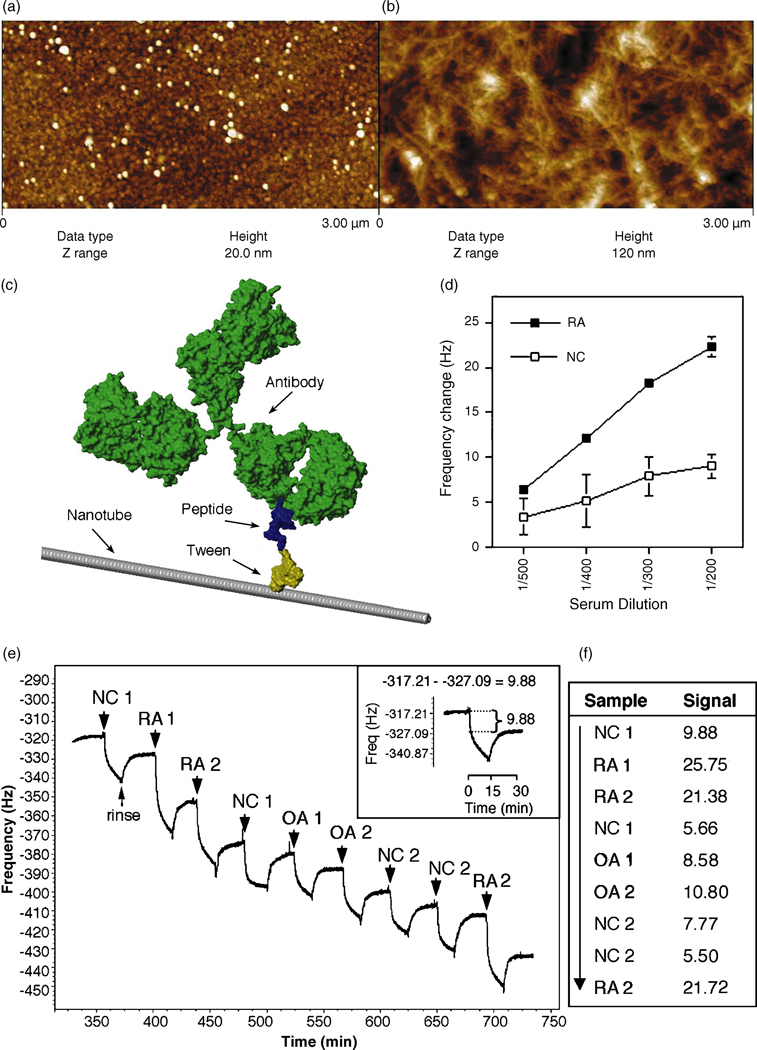
Figure 2.
Nanotube film topography by AFM imaging of (a) a bare Au surface on a QCM crystal and (b) the carbon nanotube film deposited on top; the z range (height) is much higher for the nanotube network, illustrating its high surface area and three-dimensional structure. (c) A visual representation of an antibody bound to a peptide-Tween-nanotube complex that comprises the nanotube biosensor. (d) A sample representation of a dilution curve of an RA and normal control (NC) serum in the nanotube assay measuring antibody binding to citrullinated peptide-coated nanotubes as a change in frequency (Hz). Presented is the mean ± s.e.m. (e) Raw QCM data measuring a mass uptake of antibodies in RA, normal control (NC) and osteoarthritic (OA) sera binding to citrullinated peptide-coated nanotubes seen as a decrease in frequency (Hz); each serum sample is allowed to interact with the peptide-coated nanotubes for 15 mins, followed by a 15 min rinse between sample runs. The net change in frequency post rinse is recorded as the signal of relative antibody binding (inset). (f) The signal for each sample tested in (e) is given; the arrow indicates consecutive order of samples tested in one experimental run.

