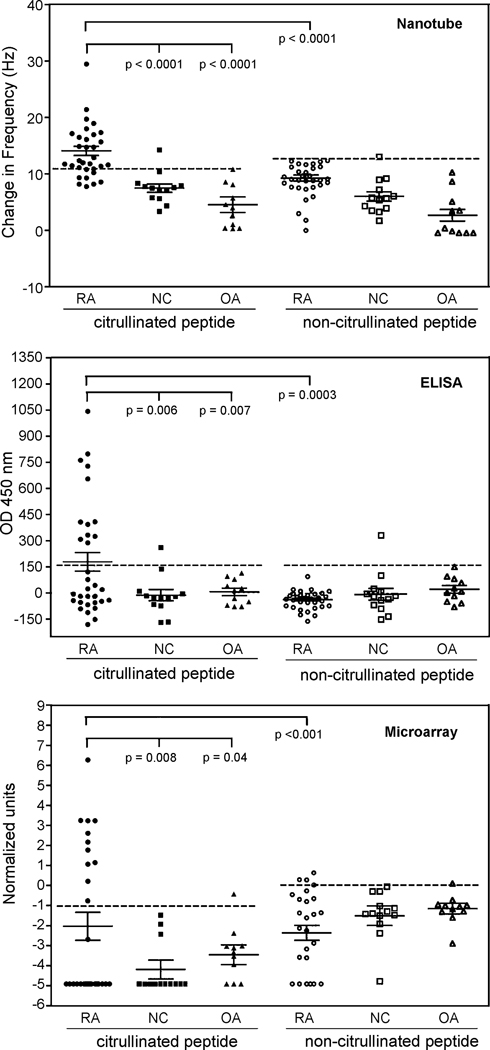
Figure 3.
Scatter plots of the level of antibodies to the citrullinated peptide or non-citrullinated peptide in the RA, normal control (NC) and osteoarthritic (OA) patient groups as measured by the three assay systems (nanotube, ELISA and microarray). The normal cut-off is indicated below the horizontal dashed line, and presented is also the mean ± s.e.m. for each serum sample group in each assay.

