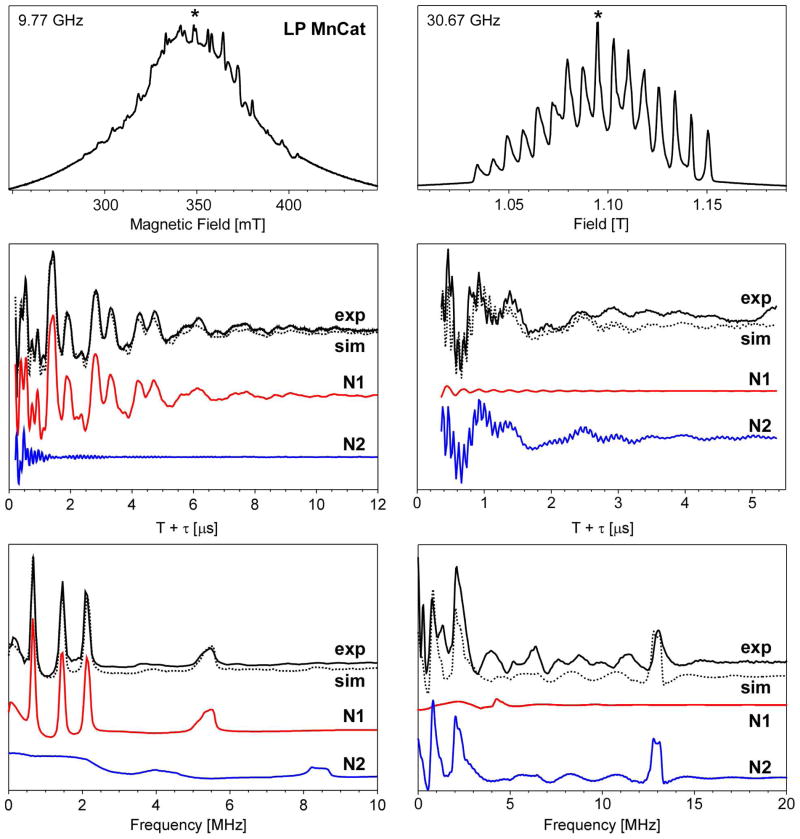
Figure 2.
Pulse EPR spectra of LP MnCat collected using 9.77 (left) and 30.67 GHz (right) microwave radiation. Top: ESE-detected field-swept EPR spectrum. Middle: 3-pulse ESEEM spectrum in resonance with g = 2.00 (348.7 mT at 9.77 GHz and 1.095 T at 30.67 GHz; see * symbol in top panels). Bottom: Cosine-backfilled Fourier transform of 3-pulse ESEEM data in middle panels. Combined (dotted) and individual simulations for two hyperfine-coupled 14N atoms are also shown: one weak (N1, red) and one strong (N2, blue).

