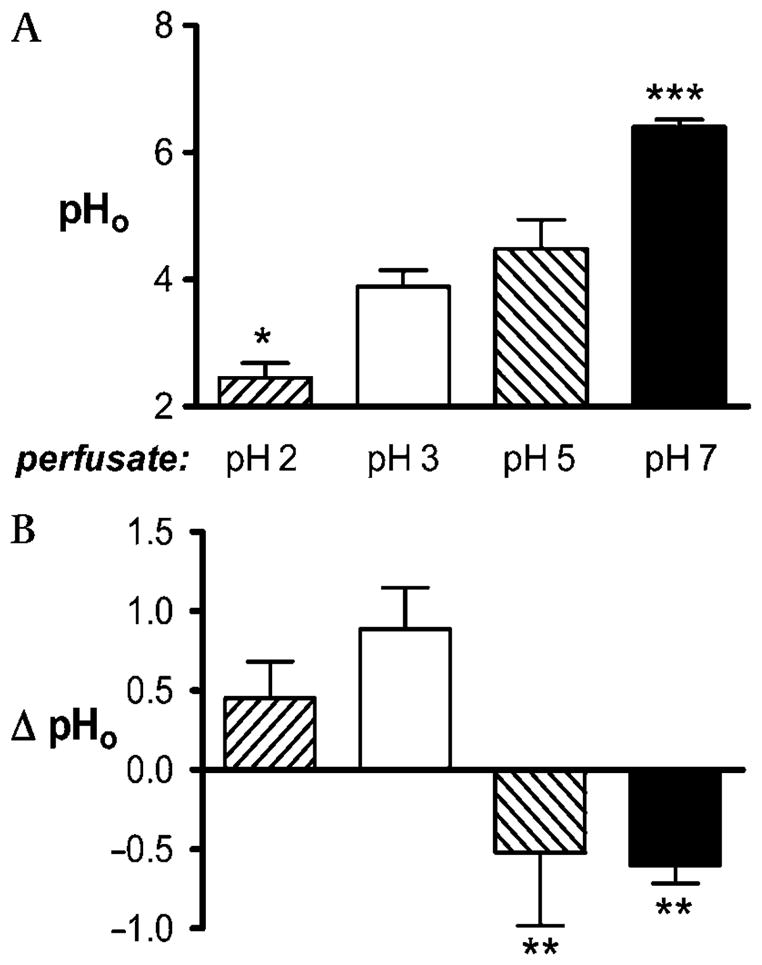
Figure 1.

Measurements of gastric surface pH (pHo) at varying luminal pH values. The gastric mucosa of anaesthetised mice was superfused with either pH 2 (n = 4), pH 3 (n = 9), pH 5 (n = 5) or pH 7 (n = 8) lightly buffered saline and equilibrated for >20 min. (A) Resting gastric pHo values at each luminal pH. (B) Change in pH between perfusate and pHo values under each condition. Data are presented as mean±SE and analysed using ANOVA, with Bonferroni’s post hoc test comparing values to those at pH 3. *p<0.05, **p<0.01, ***p<0.001.
