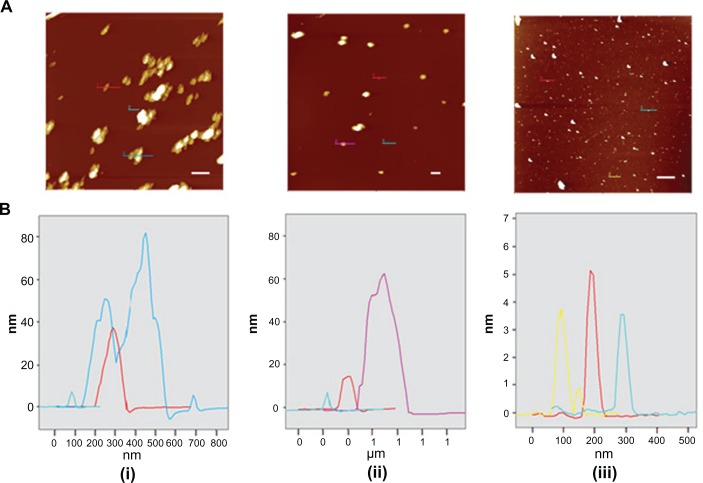
Figure 7.
(A) Intermittent contact mode atomic force microscopy topographic images of nanodiamond samples and (B) line-scan profiles of the particles indicated in each image. From left to right: (i) pristine carboxylated, (ii) reoxidized, and (iii) lysine-functionalized nanodiamonds.
Note: The bar (solid white line) represents 500 nm.

