Figure 3.
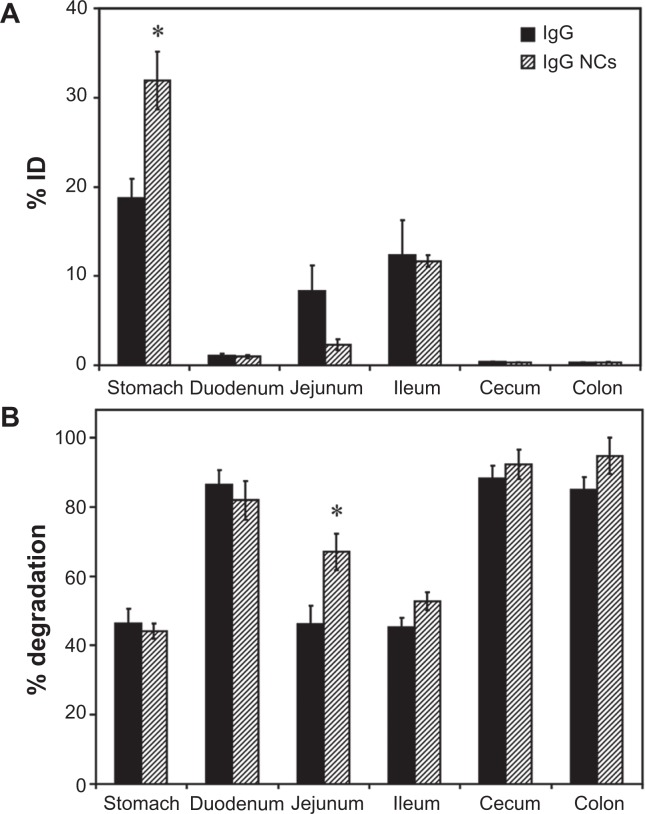
Biodistribution and degradation of IgG nanocarriers in the GI tract. Mice were gavaged with 125I-IgG-coated model polymer NCs (IgG NCs) in PBS, final diameter 269.8 ± 6.3 nm, and compared to their 125I-IgG counterparts. One hour later, the indicated sections of the GI tract were harvested and measured for their 125I-content, expressed as % ID (A). Samples were also subjected to TCA precipitation to determine the percentage of free 125Iodine, reflective of degradation (B).
Notes: Data are mean ± SEM (n ≥ 3). *P < 0.05 between IgG and IgG NC groups.
Abbreviations: GI, gastrointestinal; NC, nanocarrier; PBS, phosphate-buffered saline; % ID, percentage of the total injected dose; TCA, trichloroacetic acid; SEM, standard error of the mean.

