Figure 7.
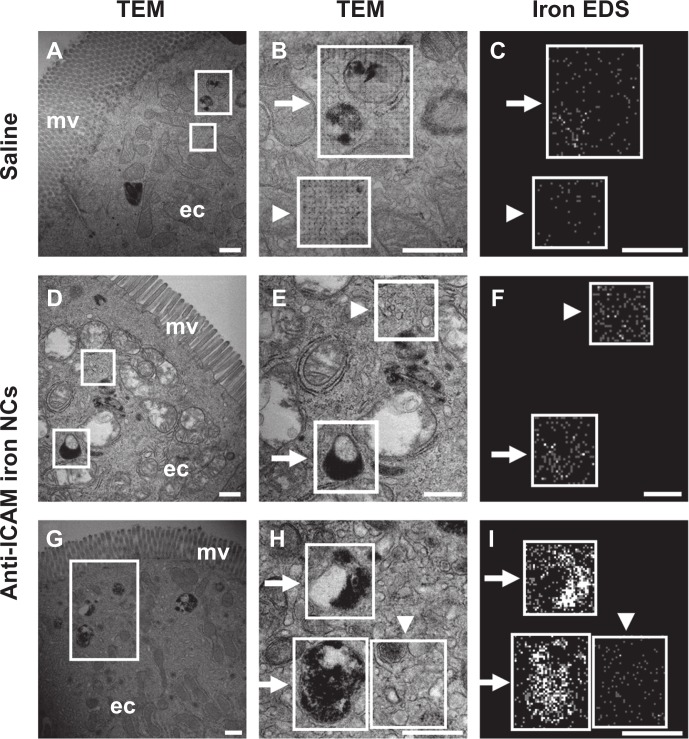
Visualization of epithelial endocytosis of anti-ICAM nanocarriers into GI tissue. Mice were gavaged with saline (A–C) or anti-ICAM-coated iron oxide nanoparticles suspended in NaHCO3 (D–I).
Notes: GI tissue was isolated after 10 minutes, processed, and imaged by TEM and iron EDS. In each row, a lower-magnification TEM image of the duodenum (left) is followed by a higher-magnification TEM image (middle) and its corresponding EDS analysis (right). White boxes indicate regions of EDS analysis. Arrows indicate electron-dense vesicular structures while arrowheads indicate non-vesicular structures. Scale bar = 500 nm.
Abbreviations: mv, microvilli; ec, enterocyte; ICAM, intercellular adhesion molecule; GI, gastrointestinal; TEM, transmission electron microscope; EDS, energy dispersive X-ray spectroscopy.

