
Figure 1.
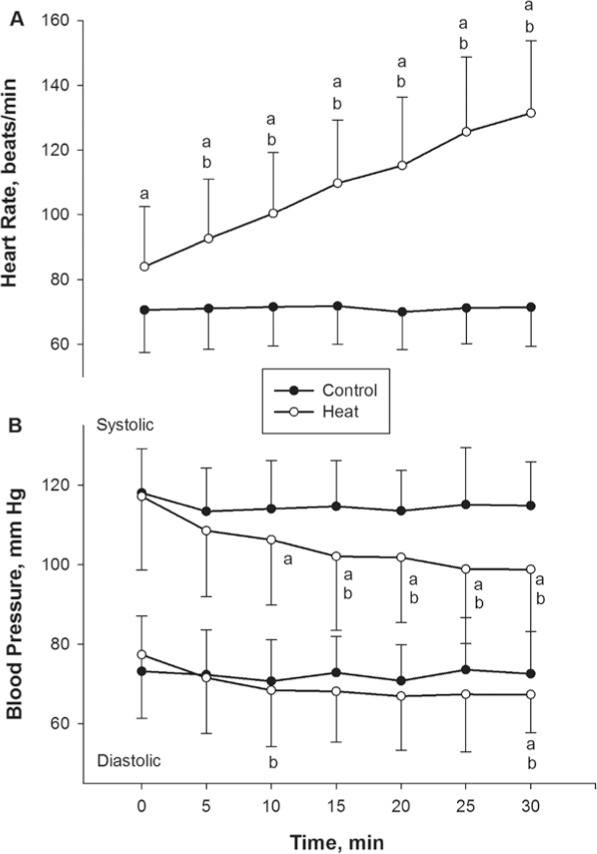
Changes in A, heart rate, and B, blood pressure, during heat and control sessions (n = 25 for both). The heart rate increased, whereas systolic blood pressure (top pair of lines) and diastolic (bottom pair of lines) blood pressure decreased during the heat session. a Indicates difference between heat and control sessions (P < .01). b Indicates difference from 0 minutes within sessions (P < .01).