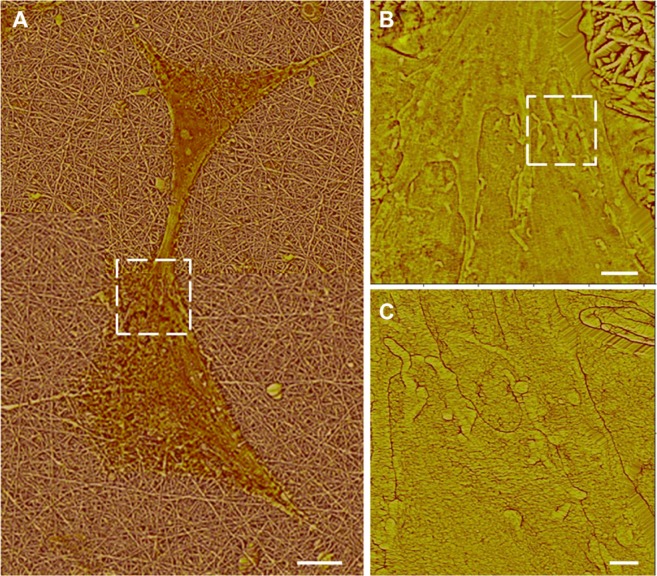
Figure 6.
Atomic force microscopy high pass filtered composite height images of astrocytes cultured on nanofibrillar scaffolds by J scanner. (A) Dashed box identifies the intercellular connection. (B) Close-up of the intercelluar connection by E scanner. Dashed box identifies a contacted area. (C) Close-up of a contacted area by E scanner.
Note: The scale bars show 10, 2, and 0.5 μm in (A), (B), and (C), respectively.

