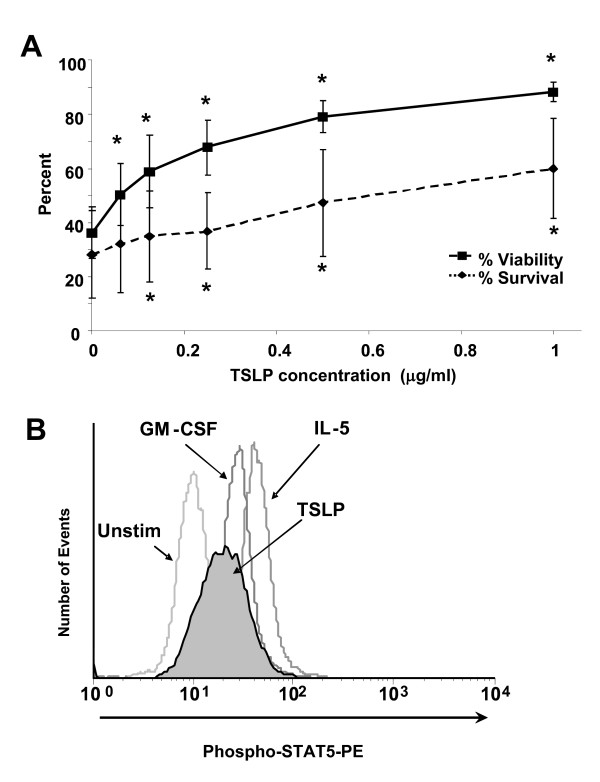
Figure 2.
Effect of TSLP on eosinophil survival and phosphorylation of STAT5. (A) The dose response curve of the effect of TSLP on eosinophil survival, shown as percent survival (0–1 μg/ml, n = 4). (B) Effect of TSLPR on eosinophil STAT5 phosphorylation. Histogram of intracellular flow cytometric analysis of phosphotyrosine STAT5 in eosinophils cultured for 15 min in medium (lightest grey line) or TSLP (1 μg/ml, black line with grey shading), compared to stimulation with IL-5 (10 ng/ml, medium grey line) and GM-CSF (10 ng/ml, dark grey line). Data are representative of eosinophils from 3 subjects. The histograms are normalized to number of events. *Statistically different from unstimulated (p < 0.05).

