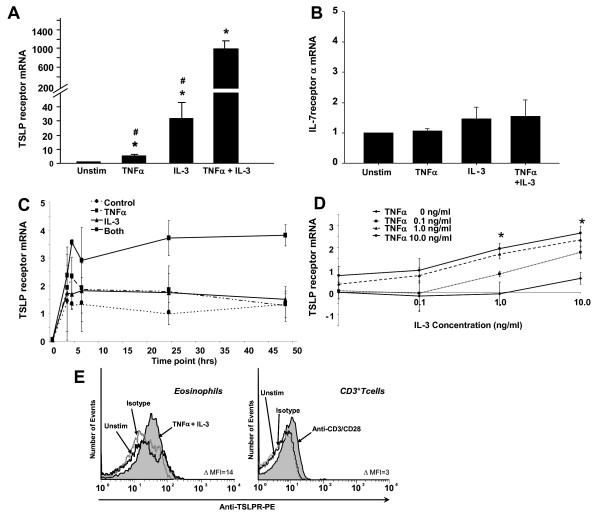
Figure 3.
Eosinophil expression of TSLPR and IL-7Rα. Quantitative real-time PCR for expression of mRNA for TSLPR (A) or IL-7Rα (B) was evaluated from eosinophils either untreated or activated for 24 h with TNFα and IL-3, alone and in combination (10 ng/ml). *Statistically different from media control (n = 5, p < 0.05). # Statistically different from IL-3 combined with TNFα (p < 0.05). (C) Time course of expression of mRNA for TSLPR in response to activation with TNFα and/or IL-3 (10 ng/ml) compared to unstimulated control was examined. (D) Dose response curve of expression of mRNA for TSLPR in response to TNFα and IL-3 (Y axis) at 24 h *Statistically different from either cytokine alone. (E) Representative histograms from flow cytometry of TSLPR on eosinophils (left histogram) treated for 24 h with either media (black line) or a combination of TNFα/IL-3 (10 ng/ml, black line with grey shading). Normal goat IgG was used as an isotype control (grey line). CD3+ T cells stimulated for 72 h with anti-CD3/CD28 coated beads were used as a positive control (right histogram). Data are representative of eosinophils from 3 subjects. The histograms are normalized to number of events. MFI differences are between unstimulated cells and TNFα/IL-3 activated cells.

