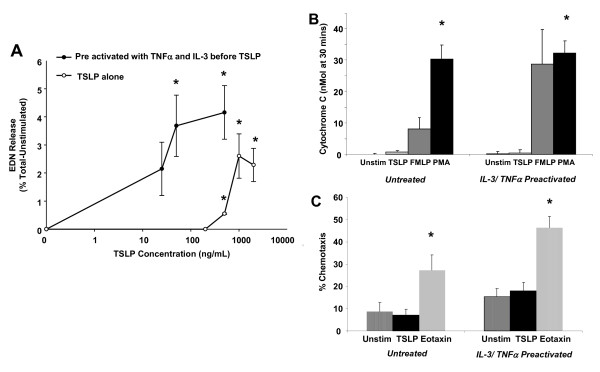
Figure 4.
Effect of pre-activation with TNFα and IL-3 on TSLP-mediated eosinophil activation. (A) The dose response curve of EDN release (as a percent of total EDN minus unstimulated release) in response to stimulation with TSLP (25–500 ng/ml, n = 3), following pre-activation for 24 h with TNFα and IL-3 (0.1 ng/ml and 1 ng/ml respectively, filled circles) is compared to EDN release from TSLP stimulated eosinophils (250–1,000 ng/ml) in the absence of pre-activation (open circles, n = 3–4). *Statistically different from unstimulated (p < 0.05). (B) Superoxide production expressed as nmol cytochrome C in response to TSLP (1 μg/ml) is compared to unstimulated control and positive controls (FMLP, PMA) with and without pre-activation with TNFα/IL-3 (10 ng/ml; n = 3). (C) Percent chemotaxis in response to TSLP (1 μg/ml) with and without pre-activation with TNFα/IL-3 (10 ng/ml) is compared to unstimulated control and eotaxin positive control (100 ng/ml, n = 3). *Statistically different from unstimulated (p < 0.05).

