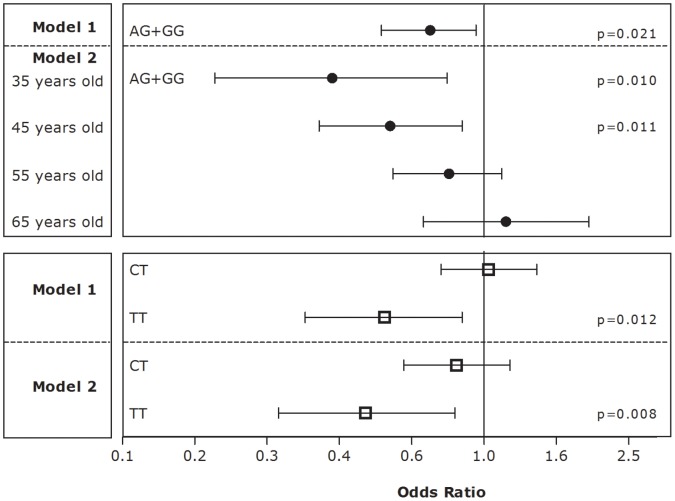
Figure 1. Estimates of the effect of the rs3732666 (black circles) and rs1061376 (white squares) on hypertension phenotype.
Estimates were assessed using logistic regression applied to the overall population (n = 791). For both genotypes, model 1 is a crude model while model 2 is adjusted for gender, age, BMI, and smoking.

