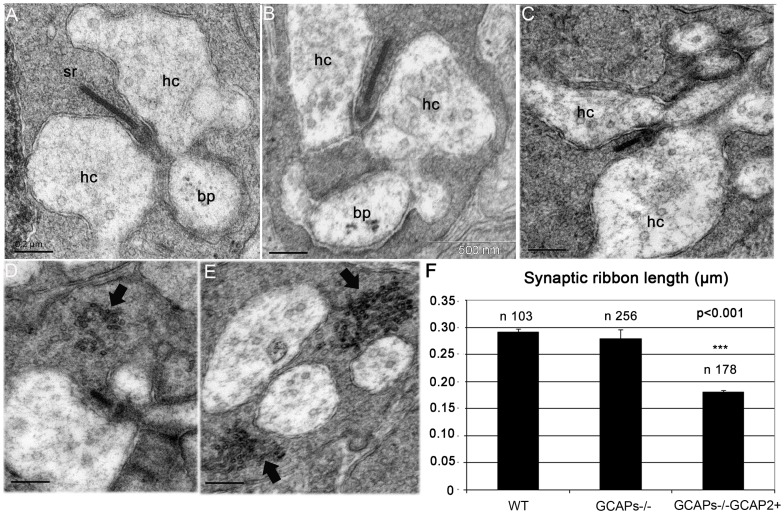
Figure 7. Expression of GCAP2 in the absence of GCAP1 exacerbates the effect of GCAP2 at promoting ribbon disassembly.
A-C. Electron micrographs from WT (A), GCAPs−/− (B) and GCAPs−/−GCAP2+ (C) ultrathin retinal sections obtained from dark-reared mice at postnatal day 40, showing a representative rod synaptic ribbon from each phenotype. While GCAPs−/− mice show ribbons that are undistinguishable in length from wildtype ribbons, GCAPs−/−GCAP2+ mice show ribbons that are on average about 40% shorter than wildtype ribbons. hc: horizontal cell process; bc: bipolar cell process; sr: synaptic ribbon. D, E. Examples of GCAPs−/−GCAP2+ synaptic terminals containing accumulations of vesicle-like particles in the vicinity of the active zone (arrows). These aggregates, that might appear in terminals with or without ribbons, might generate as by-products in the bulk endocytosis for synaptic vesicle recycling process. F. Histogram of synaptic ribbon length in WT, GCAPs−/− and GCAPs−/−GCAP2+ mice. Plotted are mean values ± standard errors. * denotes P<0.001 in ANOVA analysis [F(2, 196532) = 97,37, P = 0.000] using the PASW program package (IBM).

