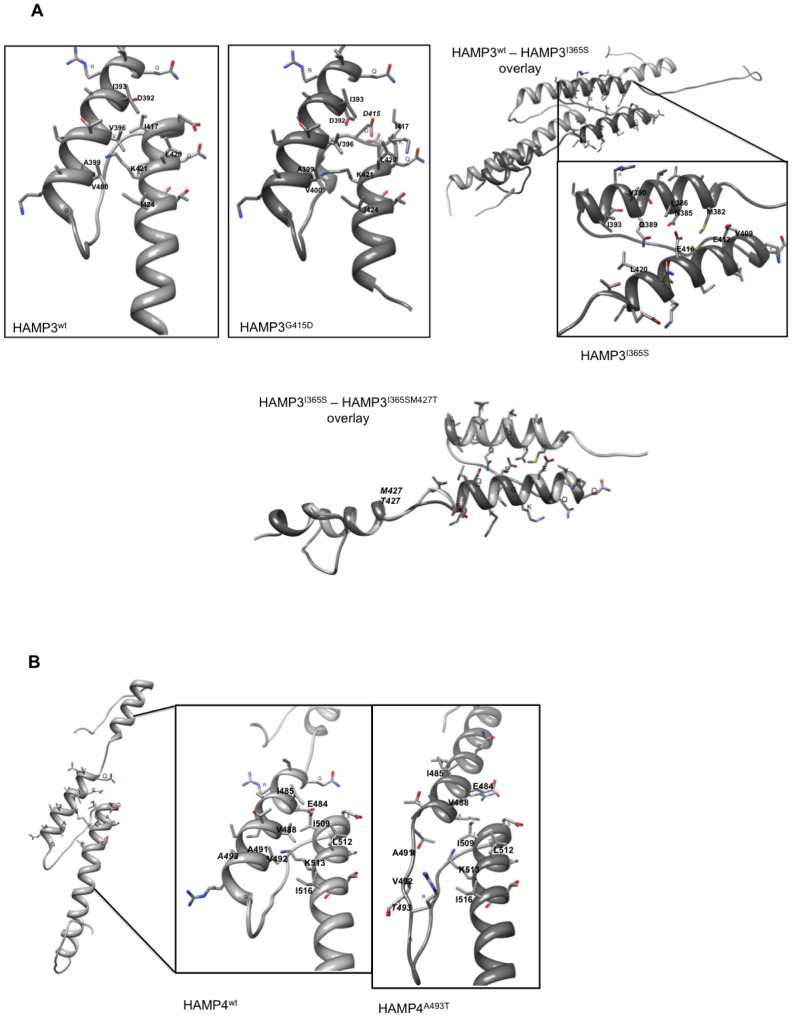
Figure 3. Homology based models of HAMP domains with focus on interactions between AS1 and AS2.
A/ HAMP3 wt and mutant peptides. In the last panel I365S (light grey) and I365S M427T (dark grey) isoforms are shown in an overlay. B/ HAMP4 wt and mutant peptides. The orientation of the peptides is from up (N-terminus) to down (C-terminus) or from right to left (A). Solely, the side chains from amino-acids of the connector proximal helices are displayed. Residues potentially involved in interactions are labelled; modified residues are written in italics. In overlaid models, the wild-type peptide is shaded in light grey, the mutant peptide in dark grey.

