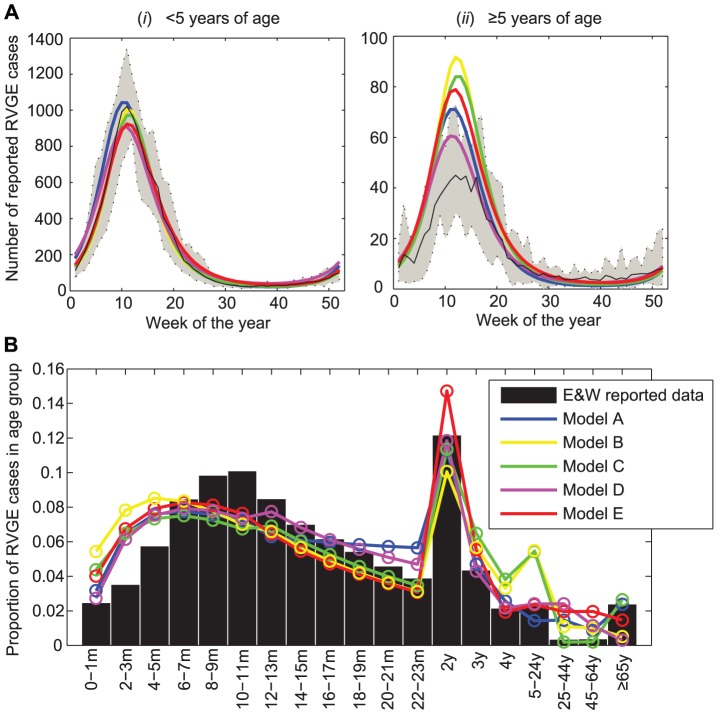
Figure 1. Fit of models to RVGE case reports from England and Wales.
(A) Mean annual size and timing of rotavirus epidemics in individuals (i) <5 years of age and (ii) ≥5 years of age. The solid black line represents the mean number of RVGE cases per week. Dashed lines show the minimum and maximum number of cases each week. Colored lines represent the fitted models: Model A (blue), Model B (yellow), Model C (green), Model D (purple), Model E (red). (B) Age distribution of reported rotavirus cases (bars) and the fitted models (colored lines).

