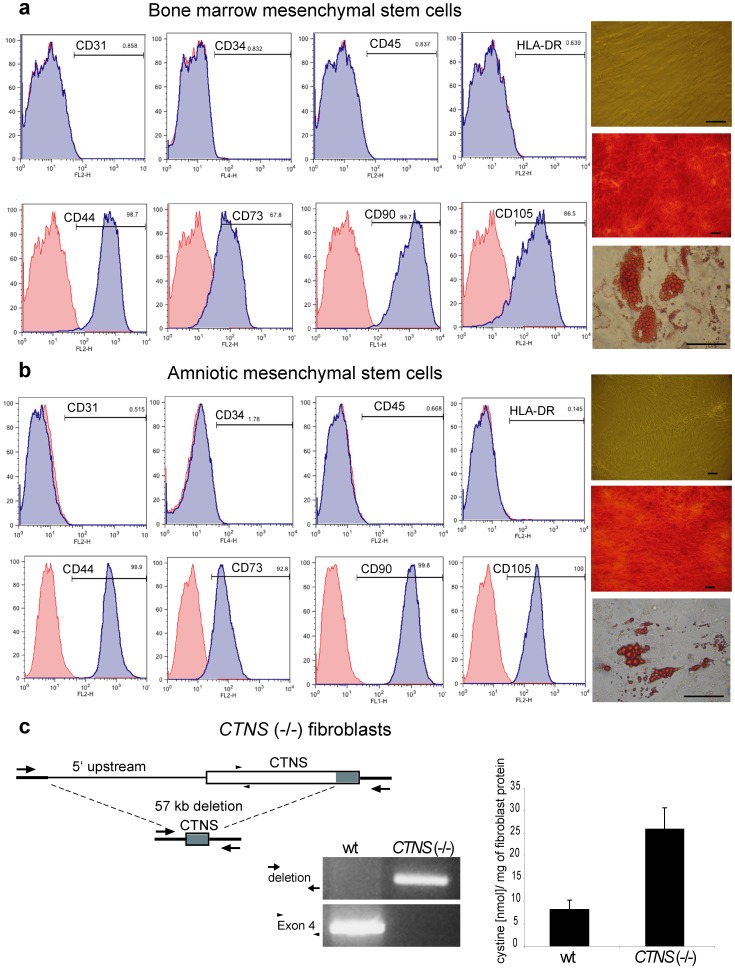
Figure 1. Characterization of mesenchymal stem cells and CTNS(−/−) mutant target cells.
(a) FACS analysis (left) of bmMSC surface markers (blue) and isotype controls (red) and bmMSC differentiation from baseline (upper right) to Alizarin Red S-stained calcium-containing osteogenic (middle right) and Oil-Red O-stained adipocyte (bottom right) phenotypes. (b) same FACS and differentiation analysis of amMSC cells. (c) schematic diagram depicting the common 57 Kb deletion removing the 5′ portion of the CTNS gene and PCR-proven genotype of control and mutant fibroblasts from a cystinosis patient. Intracellular cystine content of control and homozygous CTNS mutant fibroblasts is shown on the right bar-graph.

