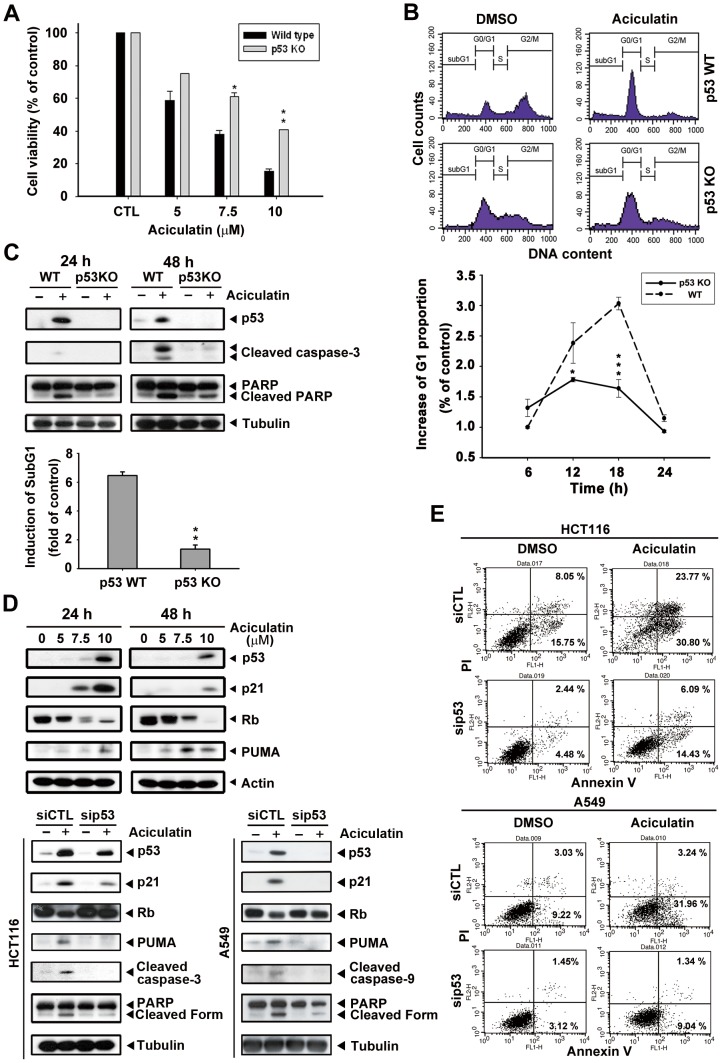
Figure 5. p53 is required for aciculatin to trigger cell cycle arrest and apoptosis.
A, p53-KO HCT116 cells were incubated with aciculatin (5–10 µM) for 48 h. Cell viability was then determined by MTT assay. The results were compared with wild-type HCT116 cells. Mean ± SE from 3 independent experiments. *P<0.05 and **P<0.01. B, p53-KO HCT116 cells were starved overnight and then incubated with vehicle (0.1% DMSO) or aciculatin (10 µM) for different periods. The DNA proportion was subsequently analyzed by PI staining. The cell cycles of p53-WT and p53-KO HCT116 cells after treatment of 18 h are shown. The G1 proportions of both cell lines were compared. Mean ± SE values from 3 independent experiments. *P<0.05 and ***P<0.001. C, p53-WT and p53-KO HCT116 cells were incubated with aciculatin (10 µM) for 24 h and 48 h and then harvested for detection of p53, caspase activation, and cleavage of PARP (upper). p53-WT and p53-KO cells were treated with vehicle (0.1% DMSO) or aciculatin (10 µM) for 24 h and were subsequently analyzed by PI staining. The induction of sub-G1 phase of each group was determined (lower bar chart). **P<0.005. D, HCT116 cells were treated with various concentrations of aciculatin (5, 7.5, and 10 µM). After 24 h and 48 h aciculatin treatment, The levels of p53, p21, pRb and PUMA were then determined (upper). p53 siRNA was used to knock down the p53 level of HCT116 and A549 cells, which were then treated with aciculatin for 24 h. The cells were harvested for detection of p53 and apoptotic related proteins (lower). E, p53 knock-down HCT116 and A549 cells were treated with aciculatin (10 µM) for 40 h and then double stained with annexin V-FITC and PI. The percentages of fluorescently labeled cells were determined by flow cytometry.

