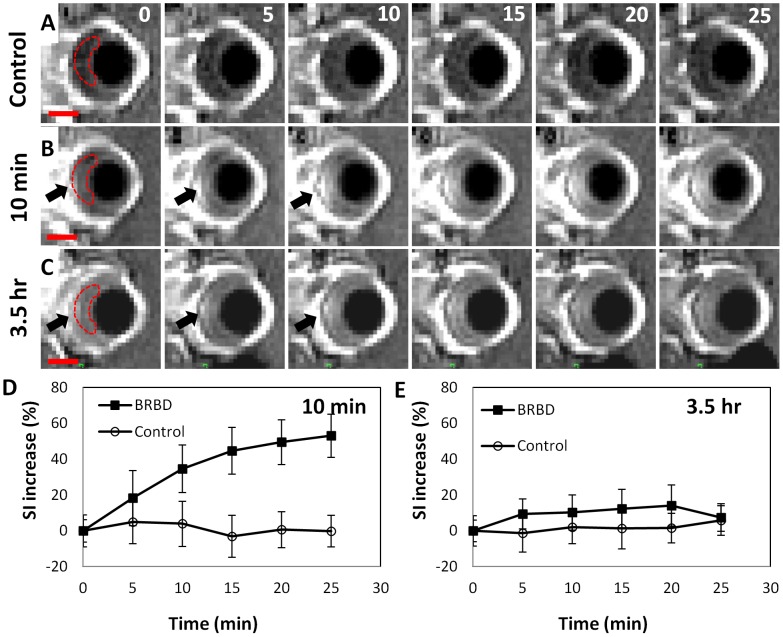
Figure 2. BRB disruption in the rat eye after sonication with microbubbles at five overlapping targets centered on the optic nerve head.
(A–C) Time-series of sagittal contrast-enhanced T1-weighted images of a rat eye acquired at 5 min intervals after an IV injection of MRI contrast agent (Gd-DTPA). (A) Control eye. (B) Gd-DTPA injection 10 min after the last sonication. (C) The second Gd-DTPA injection 3.5 h after the sonications to examine the recovery of the BRB. (D–E) The normalized signal intensity (SI) increase (spatial averaged mean ± S.D.) due to extravasation of Gd-DTPA was measured as a function of time in a region of interest (dotted line) that included the sonicated retina and the vitreous. In C and E, the BRB was not fully recovered at 3.5 h. The ultrasound beam propagated from right to left with respect to these images. The peak rarefactional pressure amplitude for sonications was 1.1 MPa with 20 µl/kg microbubbles USCA (Definity). Scale bars in A–C: 2 mm.

