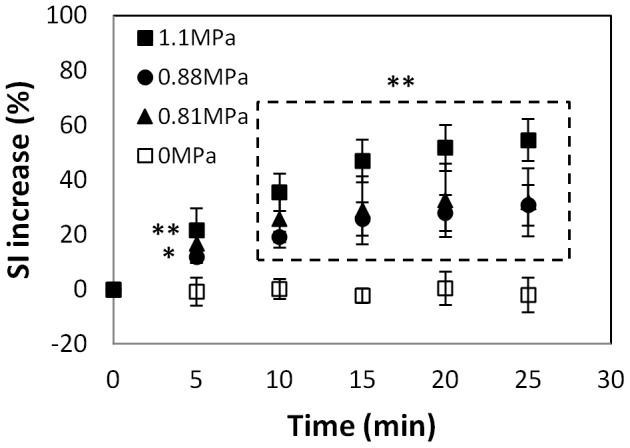
Figure 3. The average normalized signal intensity (SI) change measured in a time-series of contrast enhanced T1-weighted images for all animals (mean ± S.D.).

The horizontal axis shows the interval after Gd-DTPA injection, which was administered 10 min after the last sonication in each eye. The measurements were obtained in a region of interest that included the sonicated portion of the retina and the vitreous humor. The pressure amplitudes of these sonications were: 0.81 (N = 6), 0.88 (N = 4), 1.1 MPa (N = 6) for sonicated eyes and 0 MPa (n = 4) for the control eyes. The SI increase in the sonicated eyes was significantly larger than that in the controls at every time point (* p<0.05; ** p<0.01).
