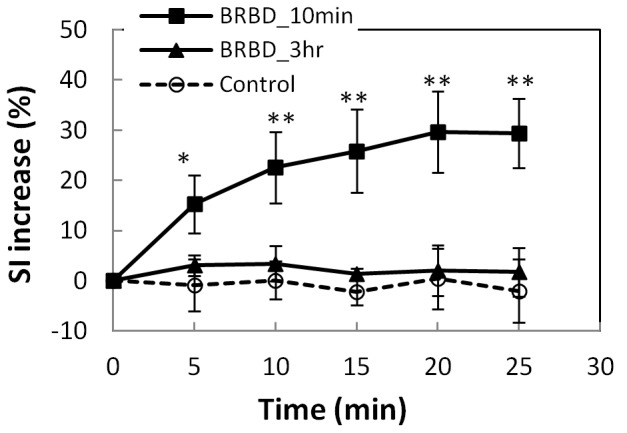
Figure 4. Recovery of the BRB 3 h after sonication at 0.81 MPa.

The signal intensity (SI) increase measured in a ROI that included the retina and the vitreous humor is plotted as a function of time after two injections of MR contrast agent (Gd-DTPA). After the first injection (10 min after the last sonication), the SI increase was significantly larger (* p<0.05; ** p<0.01) than the controls for every point in the time-series. After the second injection (3 h after sonication), the SI changes were not significantly different than the controls (p>0.05) at any time point. Data shown are the average SI increase (mean ± S.D.) for three sonicated eyes and four controls.
