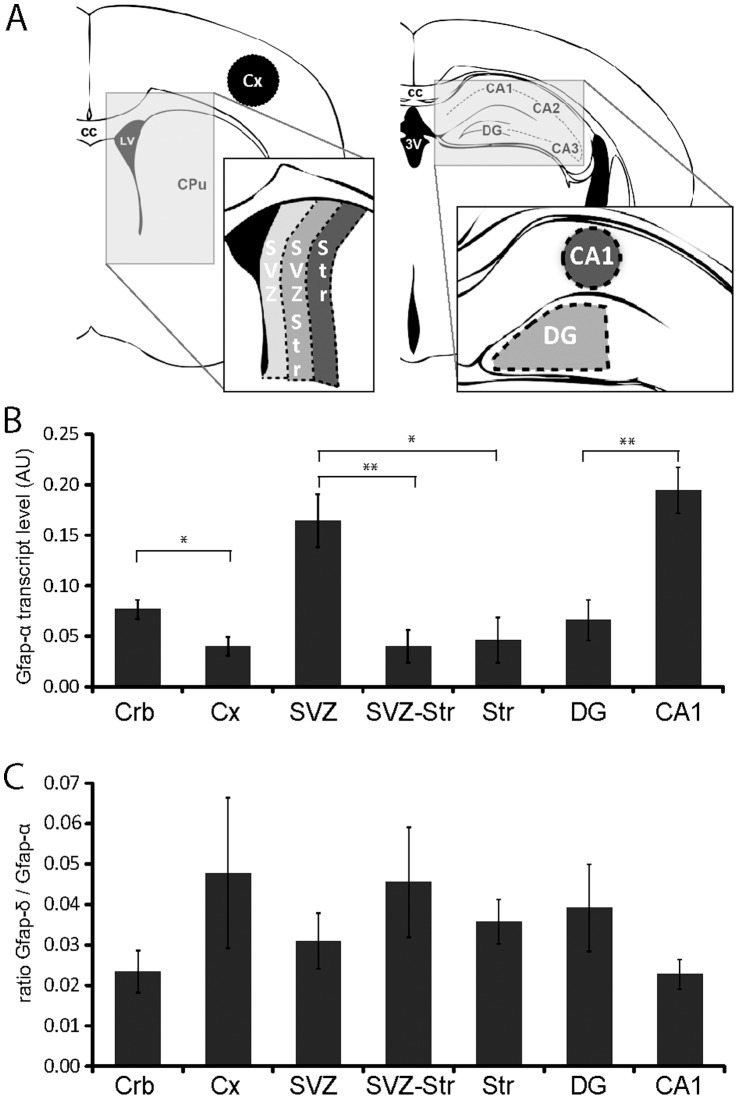
Figure 2. Transcript levels.
(A) Schematic drawings of coronal sections to illustrate the areas isolated by LDM for RNA isolation. (B) Normalized transcript levels of Gfap-α in different brain areas in arbitrary units (AU). Gfap-α displays differential transcript levels between brain areas. Note the enhanced levels in the SVZ compared to the adjacent tissue. (C) Ratio of Gfap-δ/Gfap-α transcript levels shows no detectable differences between brain regions. Data is presented as mean ± SEM, n = 7. * P<0.05; ** P<0.01.

