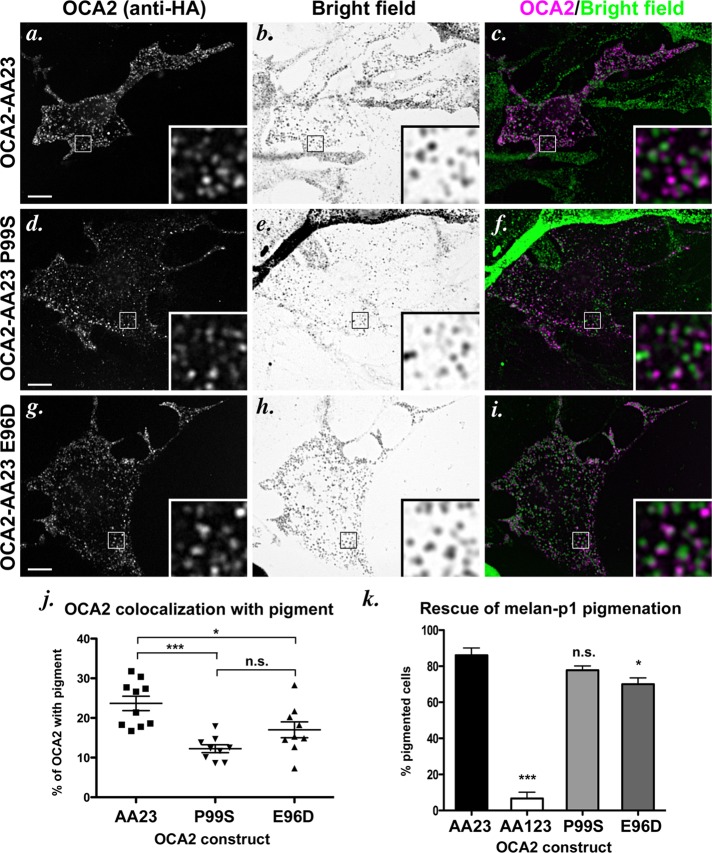
FIGURE 7:
Localization of dileucine-motif point mutants in AP-3–deficient melanocytes. (a–i) IFM analysis of AP-3–deficient cells expressing selected mutant OCA2 variants. Melan-pe melanocytes were transfected with OCA2-AA23 (a–c), OCA2-AA23 P99S (d–f), or OCA2-AA23 E96D (g–i). Transgenes were visualized with anti-HA antibodies (a, d, g), and melanosomes were visualized by bright-field microscopy (b, e, h). c, f, and i are merged OCA2-HA (magenta) and inverted bright-field (green) images. All insets show 5× magnified images of the boxed region. Bar, 10 μm. (j) Deconvolved IFM images of each mutant were converted to binary images and analyzed for marker overlap. Each data point represents one cell. Shown is the percentage of punctate/vesicular HA staining that overlapped with pigment in each cell (percentage of OCA2 with pigment). The two point mutants were significantly different from OCA2-AA23 but not from each other. *, p < 0.05; ***, p < 0.001. (k) OCA2-deficient melan-p1 melanocytes were rescued as in Figure 2j. All columns were compared with OCA2-AA23. n.s., not significant. *, p < 0.05; ***, p < 0.001.

