FIGURE 7:

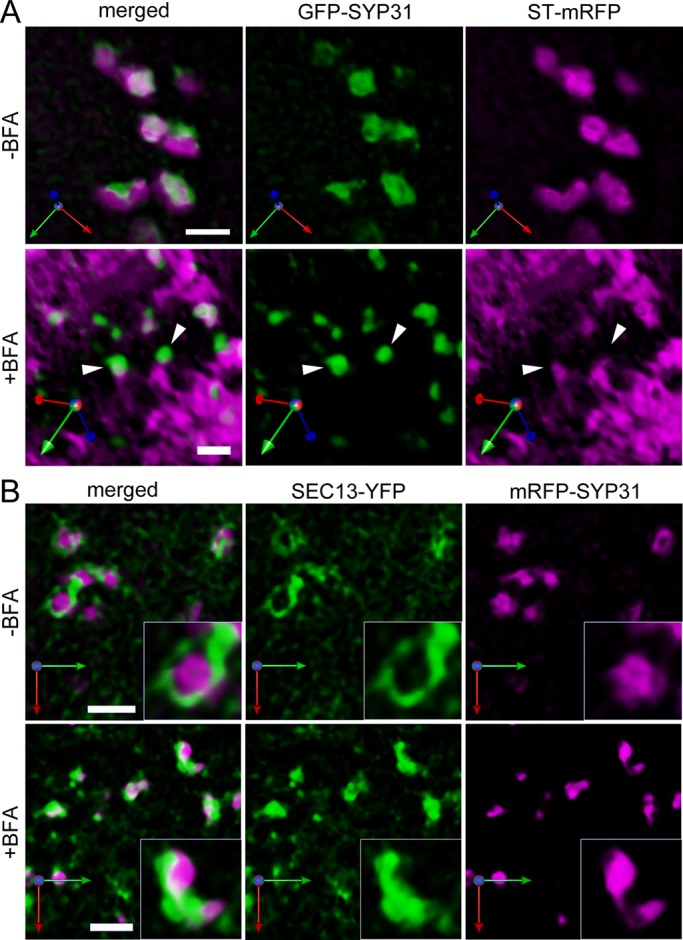
Three-dimensional deconvolution observations of the Golgi markers and ERES. BY-2 cells were observed by SCLIM with optical slices 0.2 μm apart on the Z-axis. 3D images were reconstructed and deconvolved by parameters optimized for the Yokogawa spinning-disk confocal scanner. (A) GFP-SYP31 (cis, green) and ST-mRFP (trans, magenta). Before BFA treatment (top) and after 2 h of 50 μM BFA treatment (bottom). Arrowheads indicate the punctate compartments of GFP-SYP31 on the tips of the tubular ER. (B) SEC13-YFP (ERES, green) and mRFP-SYP31 (cis, magenta). Before BFA treatment (top) and after 1.5 h of 50 μM BFA treatment (bottom). Scale bars, 2 μm.
