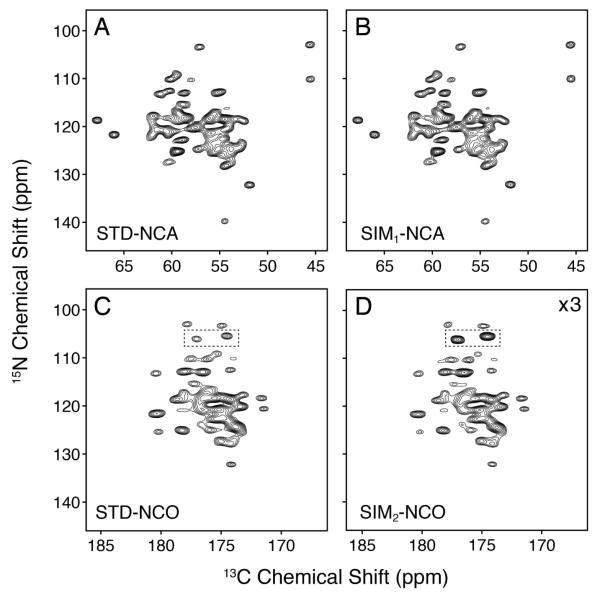
Figure 2.
Comparison of the standard vs. sequentially acquired datasets on [U-13C,15N] ubiquitin. The STD-NCA and STD-NCO datasets (A and C) used identical experimental parameters as the sequentially acquired ones (B and D). The spectra in panels A and B are each plotted starting at a contour level of 18.75. This is a factor of 1.5 higher than the SIM2-NCO dataset (panel D; first contour: 12.5). The SIM2-NCO spectrum (panel C) is plotted at 3 times the signal level compared to the STD-NCO (first contour: 37.5), which accounts for the signal loss in the SIM2-NCO from the SPECIFIC-CP transfer to 13CA. For the listed contour levels, the standard deviation of the noise is 1.0. The peaks in the dotted rectangles indicate side chain residues that have 75% intensity retention. The 2D datasets for the STD-NCA and STD-NCO together required 2 times longer acquisition than that for the SIM1-NCA and SIM2-NCO.

