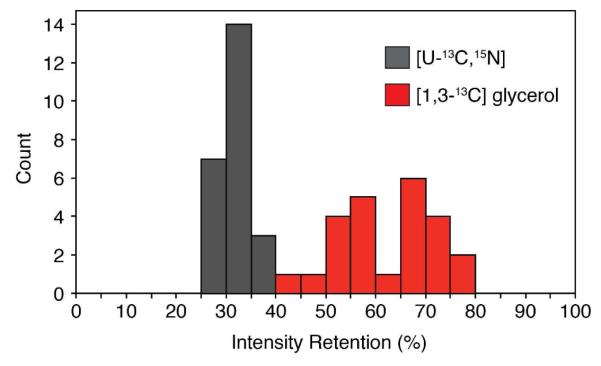
Figure 6.
Histogram of intensity retention for the [1,3-13C] glycerol vs. [U-13C,15N] labeling ubiquitin samples. The intensity retention is calculated by dividing the intensity of the resolved peak in the 2D SIM2-NCO spectrum by the corresponding resonance in the 2D STD-NCO. In total 24 resolved peaks from the 2D spectra from Figures 2 and 4 were used for this analysis. The average ± standard deviation for the two samples are: [U-13C,15N] = 32 ± 3%, [1,3-13C] glycerol = 63 ± 9%.

