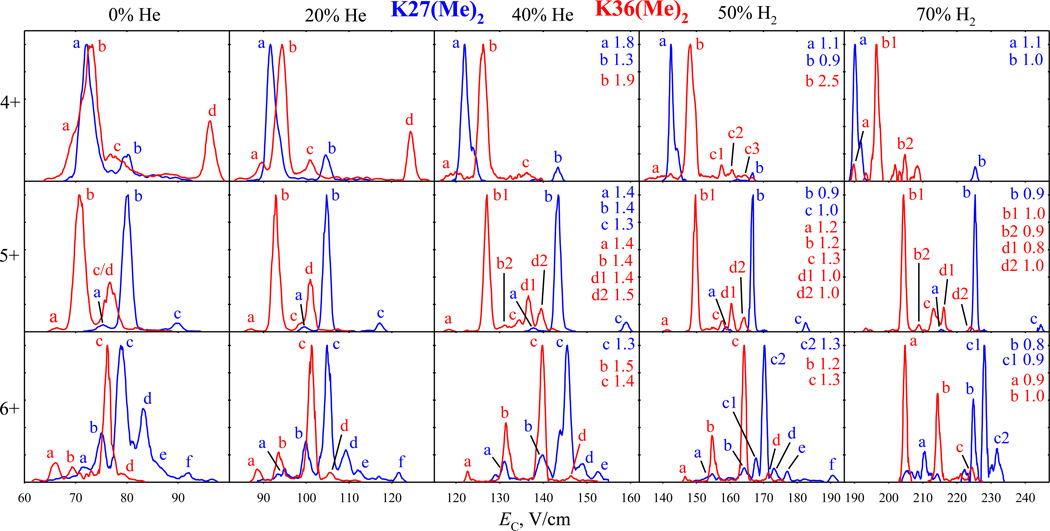
Fig. 1.
Normalized FAIMS spectra for two bismethylated localization variants of H3 tail (color-coded on the top) with z = 4 – 6, measured using He/N2 with 0 – 40% He or H2/N2 with 50% or 70% H2 (v/v), as labeled. Peaks for different conformers are marked by letters. The widths (w, V/cm) are shown for the well-shaped peaks at 40% He, 50% H2, and 70% H2. The data for intermediate gas compositions are in Figures S1 and S2.

