
Fig. 4.
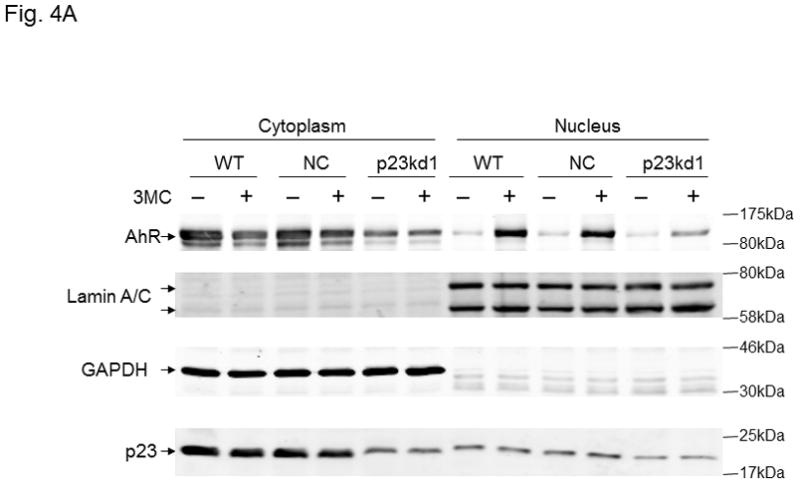
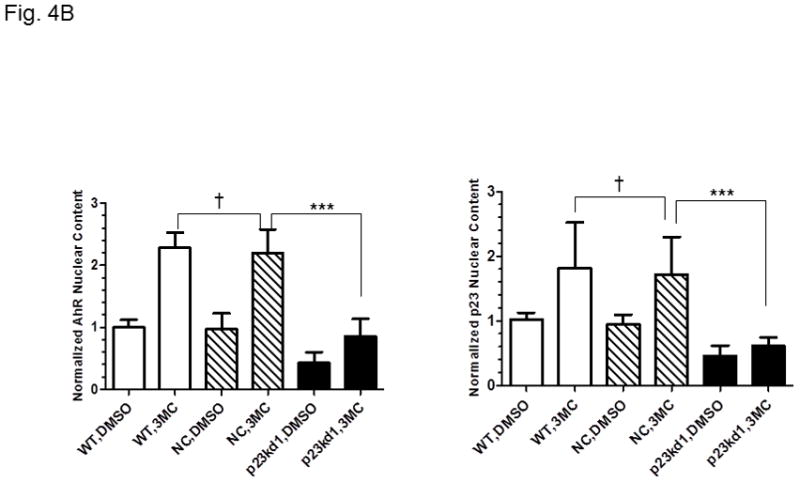
Cytoplasmic and nuclear levels of p23 and AhR in p23kd1 cells. WT, wild type Hepa1c1c7; NC, negative control knockdown stable Hepa1c1c7; p23kd1, p23-specific knockdown stable Hepa1c1c7. Cells were treated with 1 μM 3-methylcholanthrene (3MC) or vehicle DMSO alone for 1 h before fractionation. Each lane contained 20 μg of protein. GADPH and lamin A/C were marker controls for normalization for cytoplasmic and nuclear extracts, respectively. The Western images (A) are a representation of the replicate data. SA210 was used to detect AhR. Plots (B) showing the means with error bars (mean ± SD, n = 3 for left panel and n = 5 for right panel).