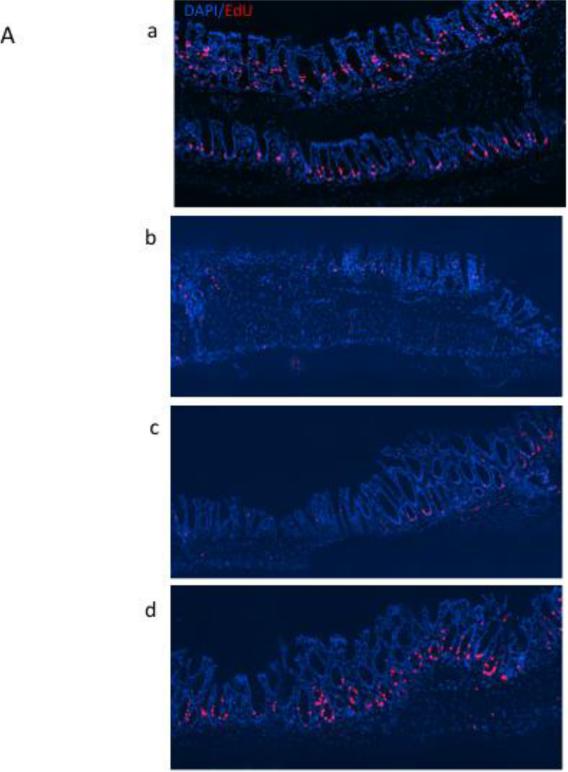
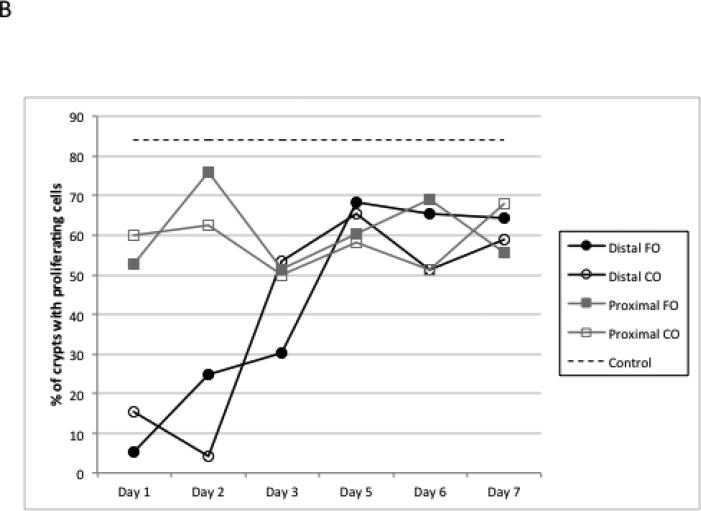
Figure 2.
Detection of proliferating (EdU+) cells following DSS exposure. A, representative photomicrographs (×100) of distal colonic crypts stained for EdU (red) with all nuclei stained with DAPI (blue), (a) untreated control, (b) DSS treated, d 2 recovery, (c) DSS treated, d 3 recovery, (d) DSS treated d 7 recovery. B, mean percentage of crypts with proliferating cells during DSS recovery. Control represents non-DSS treated mice. There was no significant difference between CO and FO fed mice at any time point (p>0.05).


